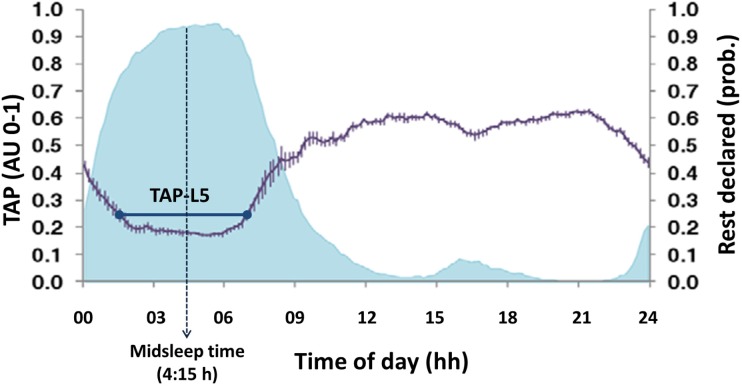
FIGURE 4.
Example of mean circadian rhythm of TAP (modified from Ortiz-Tudela et al., 2010). The violet line represents the mean waveform of TAP rhythm (value ± SEM, in arbitrary units from 0 to 1) obtained from the week recordings of wrist temperature, motor activity and body position of a sample of 49 subjects. The shaded blue area corresponds to sleep declared by subjects. The five consecutive hours of lowest values (L5) are marked by the horizontal dark blue line. The central time of that period (4:15 h approximately) is considered as midsleep time.

