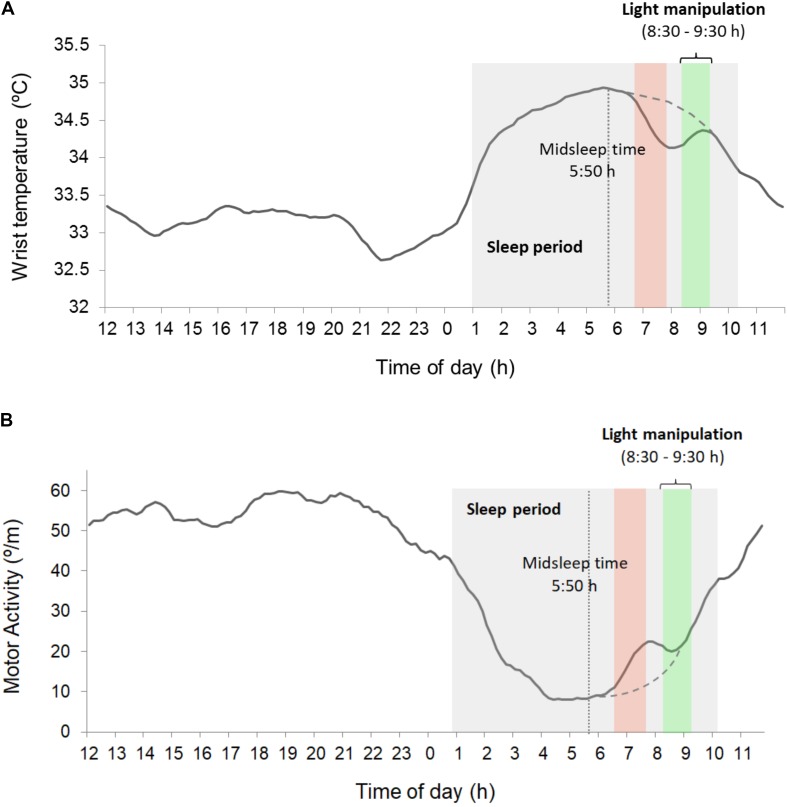
FIGURE 5.
(A) Mean temperature circadian wave. (B) Mean motor activity wave. The mean sleep period, estimated from TAP (Ortiz-Tudela et al., 2010, 2014) and characterized by the highest temperature values and lowest motor activity values, is shaded in gray. The temperature drop and activity rise between approximately 7:00 h and 8:00 h (red bar) correspond to the wakeups and displacements to the laboratory on experimental session days. The dashed line represents the expected temperature and motor activity patterns, respectively, at that time of day (obtained from free days). The green bar indicates the light exposure period during the experimental session.

