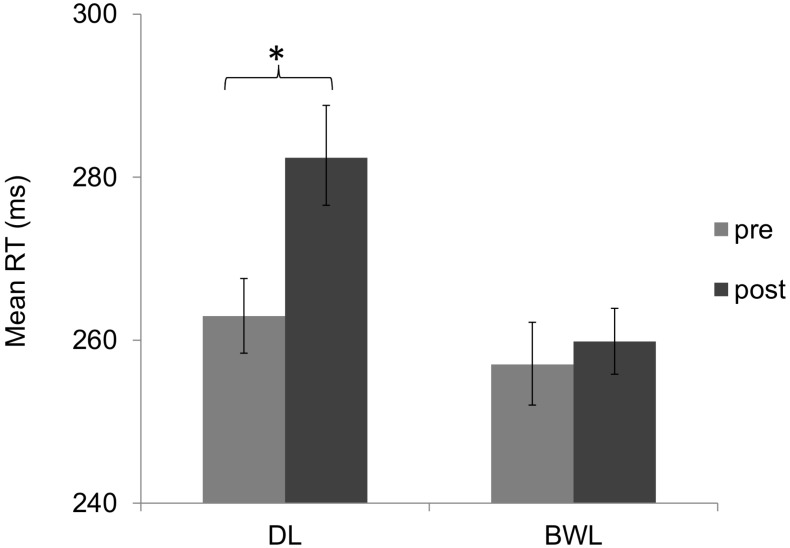
FIGURE 7.
Mean reaction times in the psychomotor vigilance task (PVT) as a function of lighting condition (dim light vs. blue-enriched white light) and time of testing: before (pre) and after (post) the driving task. Bars represent 95% confidence intervals obtained through bootstrapping. ∗Significant difference.

