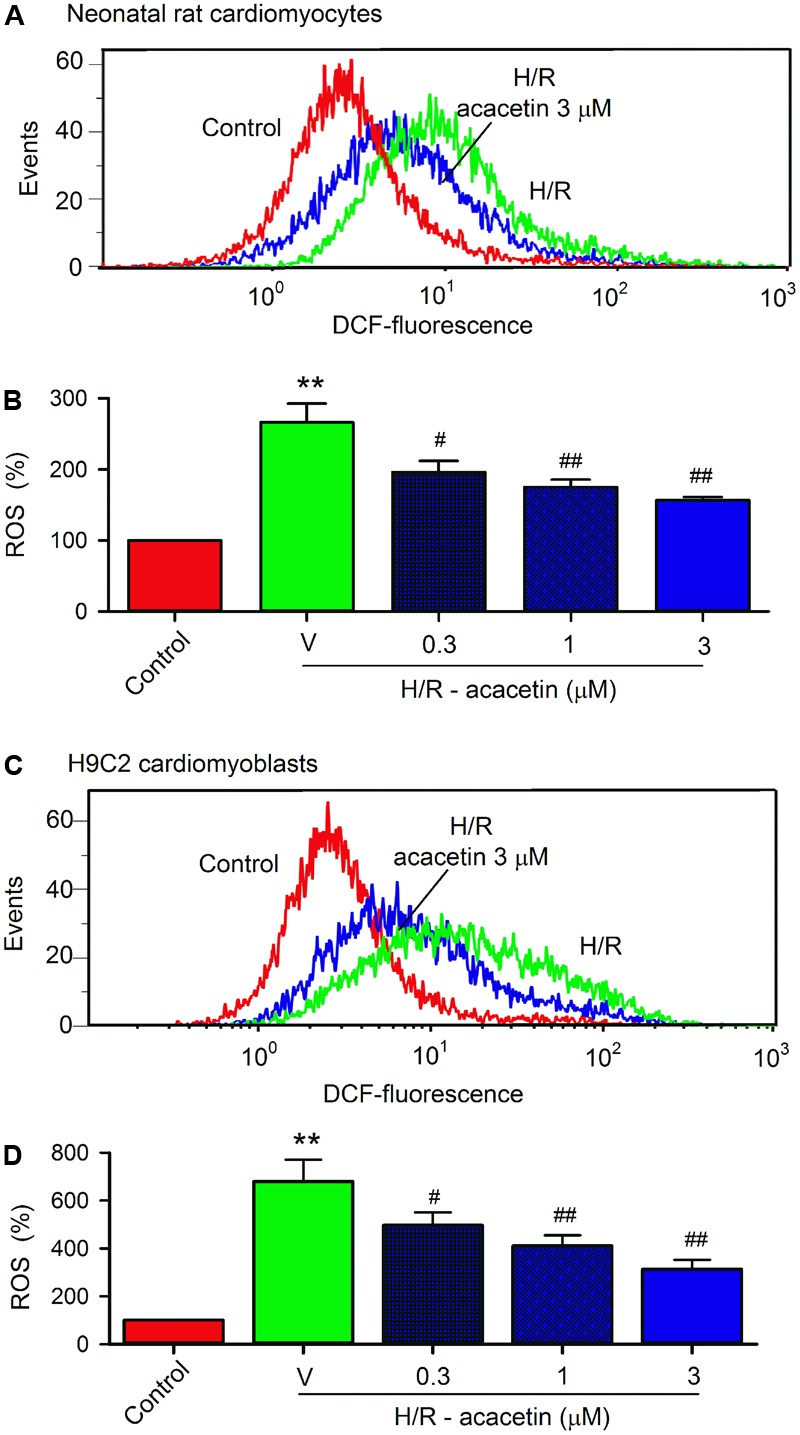
FIGURE 4.

Effect of acacetin on intracellular ROS production in cells with hypoxia/reoxygenation exposure. (A) Flow cytometry graphs showing ROS production in neonatal rat cardiomyocytes without (control) or with hypoxia/reoxygenation (H/R) exposure in the absence or presence of 3 μM acacetin. (B) Mean percent values of ROS production in neonatal rat cardiomyocytes without (control) or with hypoxia/reoxygenation (H/R) exposure in the absence (V, vehicle) or presence of 0.3, 1, or 3 μM acacetin. (C) Flow cytometry graphs showing ROS production in H9C2 cardiomyoblasts with the treatment used in (A). (D) Mean percent values of ROS production in H9C2 cardiomyoblasts with the treatment used in (B). Data were expressed as mean ± SEM and analyzed by one-way ANOVA followed by the Bonferroni-test (n = 5 individual experiments, ∗∗P < 0.01 vs. control; #P < 0.05 and ##P < 0.01 compared with the hypoxia/reoxygenation alone).
