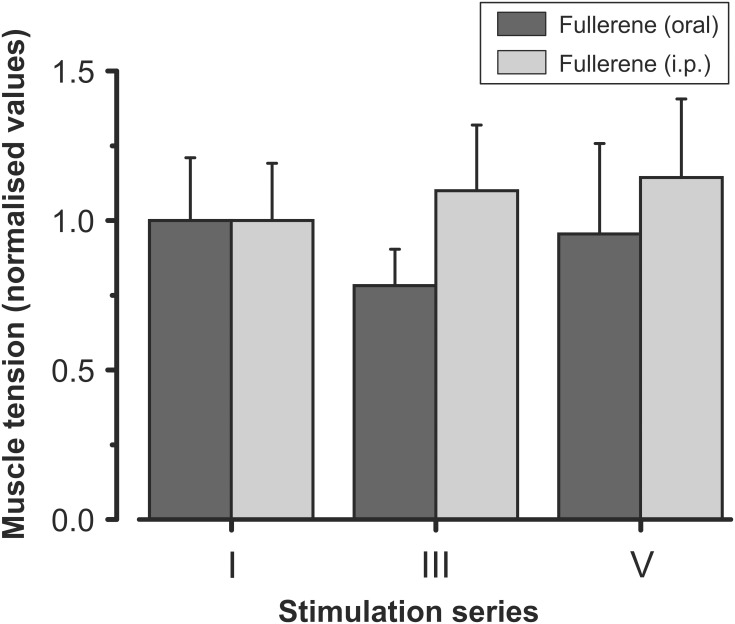
FIGURE 3.
Averaged characteristics (mean ± SD) of the normalized (with respect to the first stimulation series) values of the muscle strength after preliminary intraperitoneal injection and oral administration of C60FAS (dark gray and light gray bars, respectively). I, III, and V – series of electrical fatiguing stimulation. Values of six animals in each group were averaged according to stimulation series. Note the absence of significant differences between data obtained in rats of groups 3 and 4.

