Figure 2.

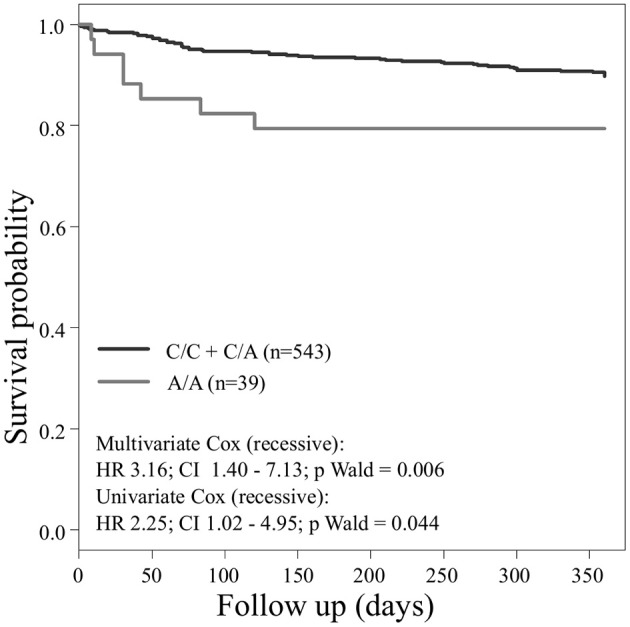
Kaplan–Meier curves showing cumulative survival (combined endpoint all-cause death and/or Ml and/or ischemic stroke) stratified according to Pear1 rs2768759 carriers of major allele (black) and homozygous carriers of minor allele (gray).

Kaplan–Meier curves showing cumulative survival (combined endpoint all-cause death and/or Ml and/or ischemic stroke) stratified according to Pear1 rs2768759 carriers of major allele (black) and homozygous carriers of minor allele (gray).