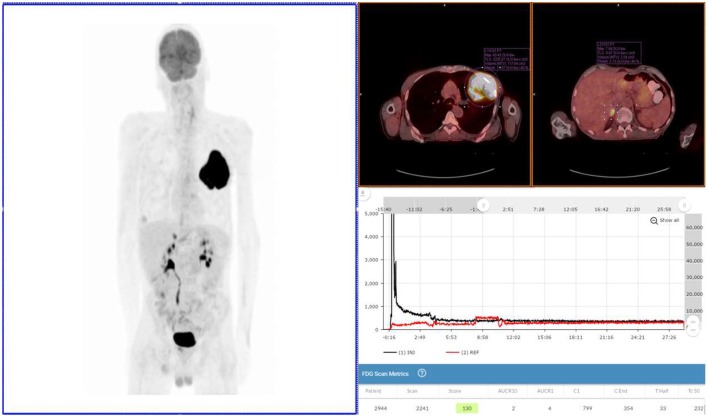
Figure 2.
Exam 2—maximum intensity projection image, fused axial images, and time-activity curves of repeat PET/CT Scan. Repeat PET/CT MIP image (above left image), taken 3 days after first PET/CT and 65 min post-injection, reveals lung mass, right adrenal lesion, prostate lesion, and some minimal abnormal uptake in left forearm (radiotracer injection site was left hand). Black time-activity curve (lower right image) from injection arm sensor reveals a nearly ideal injection. Red time-activity curve (also lower right image) from contralateral arm sensor reveals expected uptake. Fused PET/CT images (upper right images) reveal left lobe mass (SUVmax 43) and adrenal lesion.

