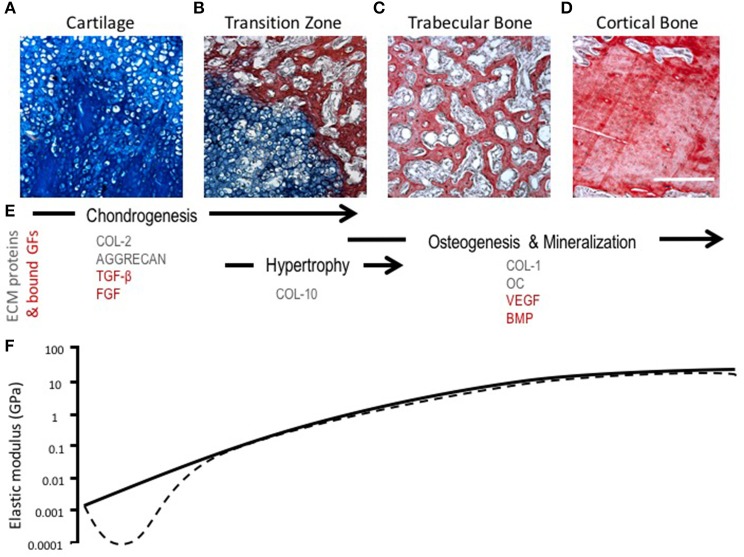
Figure 3.
Morphological, compositional, and mechanical changes during endochondral ossification (EO). (A–D) HBQ histology (blue = cartilage, red = bone) of representative tissues from a murine fracture callus throughout stages of healing: (A) cartilage, (B) transition zone, (C) trabecular bone, and (D) cortical bone. Scale bar = 200 μm. (E) Tissue matrix components and matrix-bound growth factors corresponding to the location and phases of EO (Chintala et al., 1994; Shen, 2005; Eyre et al., 2006; Martel-Pelletier et al., 2008; Maldonado and Nam, 2013; Martino et al., 2013; Tampieri and Sprio, 2016; Tomlinson et al., 2016). (F) Log scale difference in elastic modulus of human samples corresponding to each tissue matrix listed above. Solid line represents normal ossification, dotted line accounts for the initial decline in elastic modulus (osteoarthritis model) (Ashman and Jae Young Rho, 1988; Rho et al., 1993; Mente and Lewis, 1994; Silver et al., 2002; Pal, 2014).

