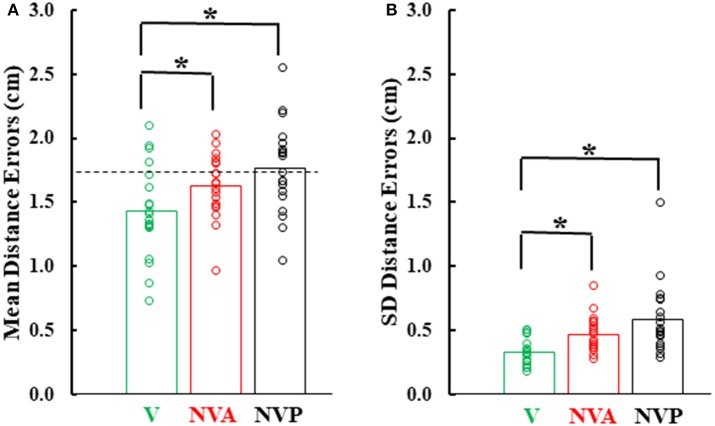
Figure 6.
(A) Bar graphs showing mean distance errors and in (B), mean distance variable errors across subjects in the 3 experimental conditions. The dashed line in (A) represents the mean distance error between the sensors when subjects slowly and deliberately touched their index fingertips. Also plotted on each bar are symbols showing the individual subject mean distance errors and distance variable errors. *statistically significant (p < 0.001) differences between the vision (V) condition and the NV conditions (NVA, NVP).

