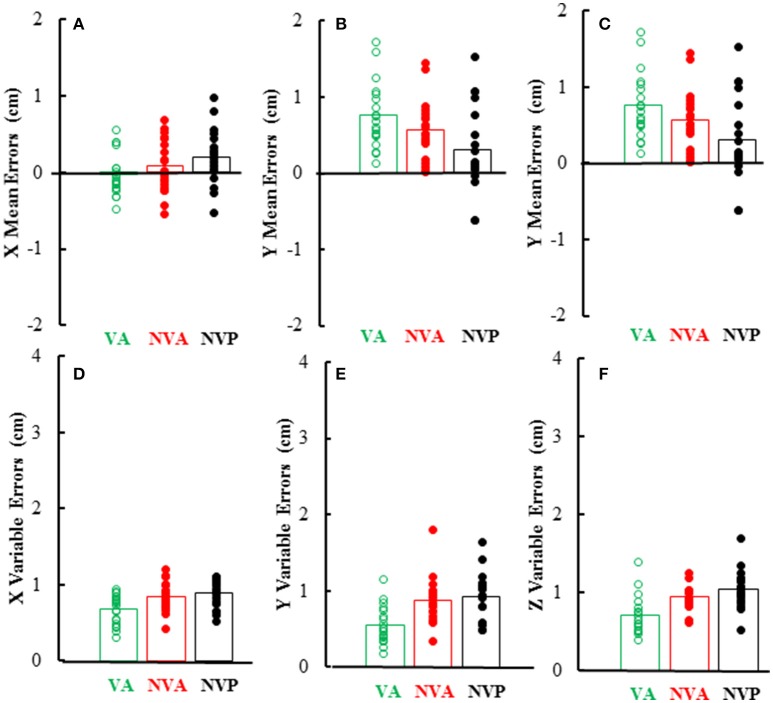
Figure 7.
Bar graphs showing mean directional distance errors in each direction (A–C) and mean distance variable errors (D–F) in the 3 experimental conditions. Also plotted on each bar are symbols showing the individual subject mean directional distance errors (A–C) and distance variable errors (D–F).

