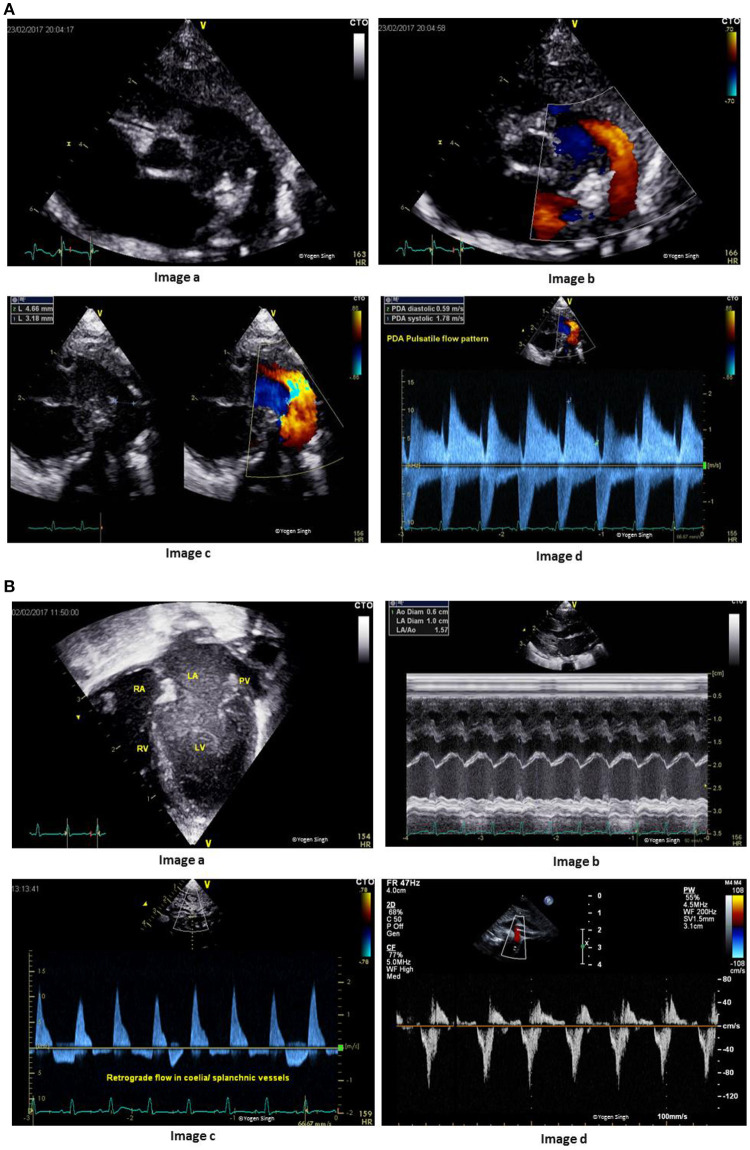
Figure 6.
(A) Assessment of patent ductus arteriosus (PDA). Image “a” shows PDA on 2D imaging; Image “b” shows PDA on color flow mapping; Image “c” assessment of PDA size on 2D and color flow mapping; and Image “d” shows pulsatile flow pattern on Doppler assessment. (B) Hemodynamic assessment of PDA for assessing pulmonary hyperperfusion and systemic hypoperfusion. Image “a” shows volume overloading left side of the heart in apical 4-chamber view; Image “b” shows measurement of left atrium to aorta ratio (LA:Ao ratio); Image “c” shows retrograde flow in splanchnic vessels; and Image “d” retrograde flow in descending aorta (“steal phenomenon”) in a hemodynamically significant large PDA.

