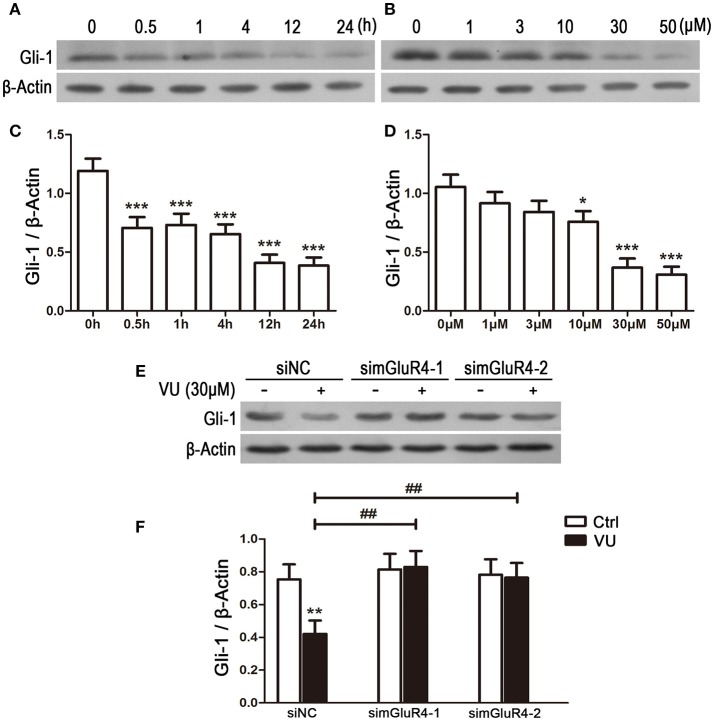
Figure 5.
Activation of mGluR4 suppresses the expression of Gli-1 in LN229 cells. (A,C) LN229 cells were treated with 30 μM of VU0155041 (VU) for different durations (0, 0.5, 1, 4, 12, and 24 h). Representative western blot (WB) bands (A) and quantitative analysis (C) are shown to illustrate the time-dependent decrease in Gli-1 expression. ***P < 0.001 vs. control. (B,D) LN229 cells were treated with serial concentrations of VU (1, 3, 10, 30, and 50 μM) for 24 h. Representative WB bands (B) and quantitative analysis (D) are presented to illustrate the dose-dependent decrease of Gli-1 expression. *P < 0.05, ***P < 0.001 vs. control. (E,F) LN229 cells were transfected with non-specific siRNA (siNC) and two mGluR4 specific siRNAs (simGluR4-1 and simGluR4-2), followed by treatment with the vehicle (Ctrl) or 30 μM of VU for 24 h. Then, the expression of Gli-1 was determined by WB (E). WB bands were quantified to generate the ratio of Gli-1 to β-actin (F), and each value represents the mean ± SD of three independent experiments. **P <0.01 vs. Ctrl; ##P < 0.01 vs. VU group.

