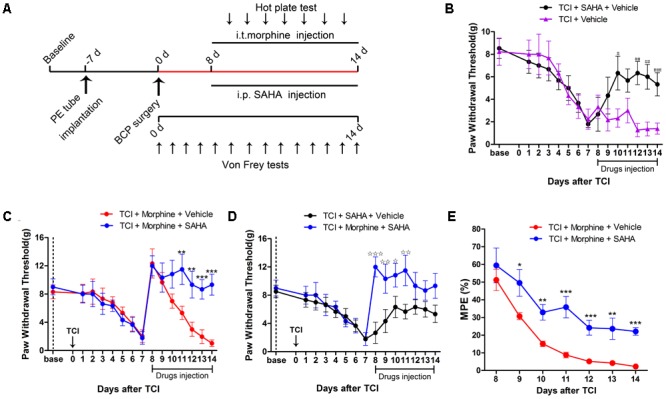
FIGURE 5.

SAHA administration attenuated morphine tolerance in BCP. (A) Experimental paradigms. (B) Comparisons of PWT of rats in the TCI + SAHA + Vehicle and the TCI + Vehicle group (n = 6 rats in each group). (C) Comparisons of PWT of rats in the TCI + Morphine + Vehicle and the TCI + Morphine + SAHA group (n = 6 rats in each group). (D) Comparisons of PWT of rats in the TCI + SAHA + Vehicle and the TCI + Morphine + SAHA group (n = 6 rats in each group). (E) Comparisons of MPE of rats in the TCI + Morphine + Vehicle and the TCI + Morphine + SAHA (n = 6 rats in each group). Data are expressed as the mean ± SEM. #p < 0.05, ##p < 0.01, ###p < 0.001 versus the TCI + Vehicle group, ∗p < 0.05, ∗∗p < 0.01, ∗∗∗p < 0.001 versus the TCI + morphine + Vehicle group, *p < 0.05, **p < 0.01, ***p < 0.001 versus the TCI + SAHA + Vehicle group.
