
FIGURE 8.
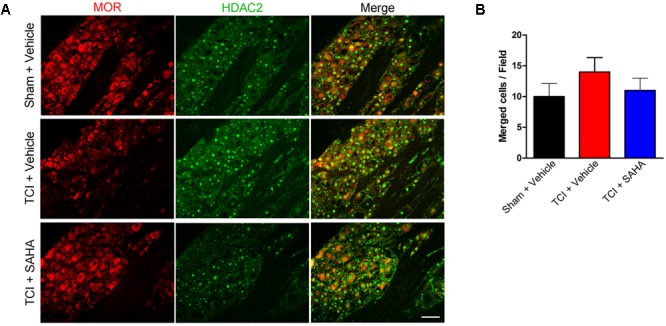
The co-localization of HDAC2 and MOR in the DRG of the Sham + Vehicle, the TCI + Vehicle and the TCI + SAHA group. (A) Double-staining immunofluorescence images showing the co-localization of MOR (red fluorescence) and HDAC2 (green fluorescence) in the DRG of the Sham + Vehicle, the TCI + Vehicle and the TCI + SAHA group on POD 14. Scale bar: 100 μm. (B) Quantitative analysis of the double-labeled neurons in the DRG in all three tested groups (n = 5 in each group). Data are expressed as the mean ± SEM.