Figure 2.
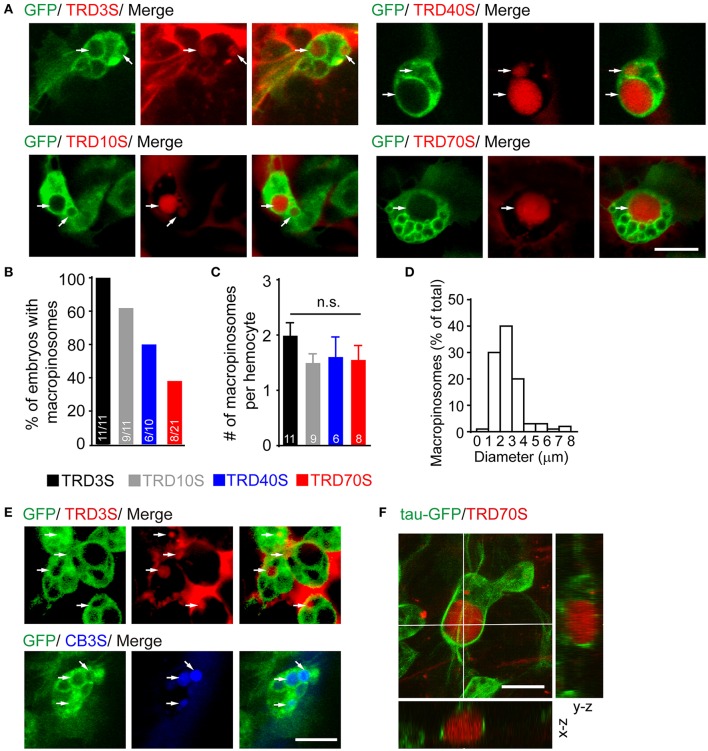
ATPγS induced macropinosomes in Drosophila embryonic hemocytes. (A) Hemocytes (green) uptook fluorescent dextrans ranged from 3-kDa (TRD3S) to 70-kDa (TRD70S) dextrans and generated macropinosomes (arrows). (B) Success rates were defined as the percentage of embryos where hemocytes with macropinosomes 1.5 h after completion of different-sized dextrans injected. (C) Numbers (#) of macropinosomes in each hemocyte. P-values were calculated using one-way ANOVA among groups; n.s.: non-significant. (D) The size-distribution pattern of macropinosomes containing TRD3S (n = 100 macropinosomes, from 11 embryos). (E) Both TRITC labeled (red, TRD3S) and cascade blue labeled (blue, CB3S) dextrans were feasible to be uptaken by GFP-positive hemocytes (green), and formed macropinosomes (arrows). (F) In-depth 3D reconstruction analysis of ATPγS induced macropinosomes using a spatial deconvolution. Note that TRD70S dextran (red) labeled macropinosomes (red) and their surrounding GFP-positive microtubule-structures (green). Images were displayed in x-y (top), x-z (bottom), and y-z (right) projections. Scale bars, 10 μm.

