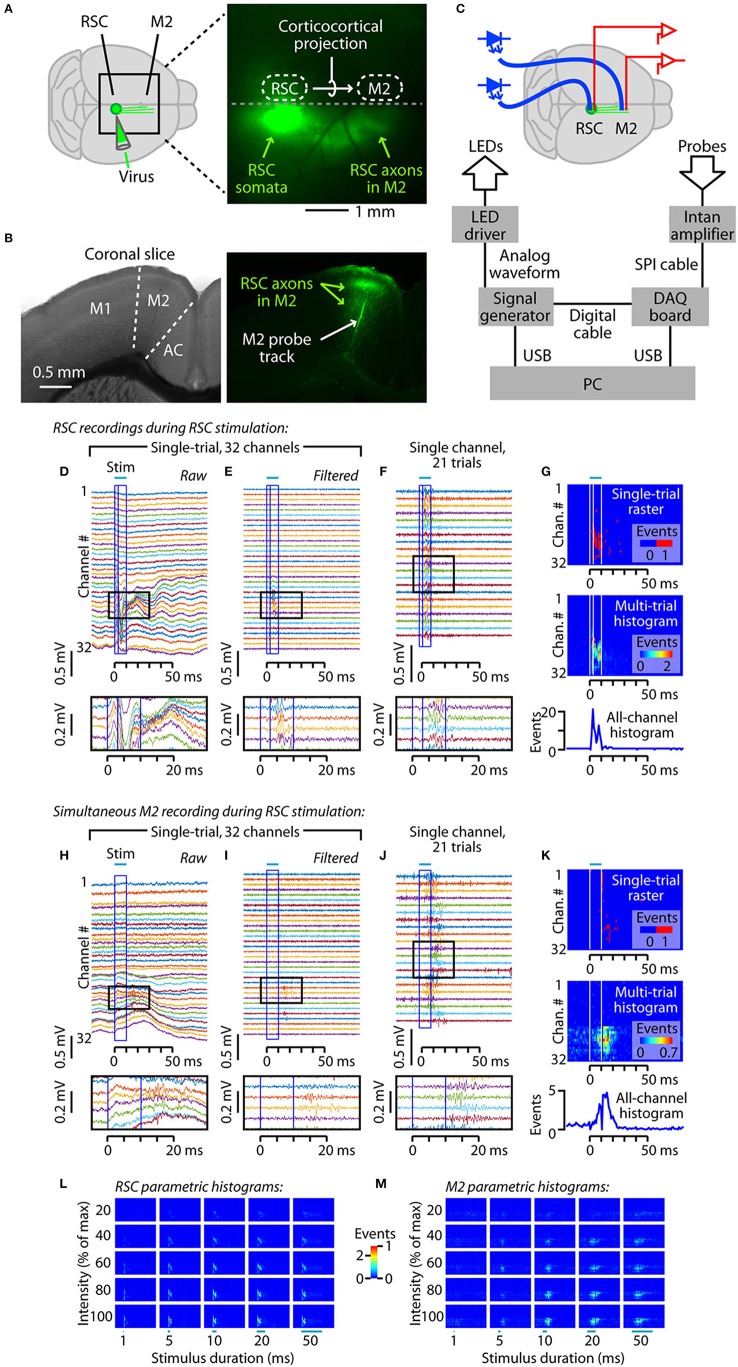
Figure 1.
Experimental paradigm for characterizing inter-areal signaling in the corticocortical projection from retrosplenial (RSC) to posterior secondary motor (M2) cortex. (A) Virus injection in RSC infects somata at the injection site, resulting in anterograde labeling of RSC axons projecting to M2. Right: epifluorescence image of the dorsal surface of the brain of an anesthetized mouse, showing labeled axons projecting from RSC to posterior M2. (B) Coronal brain slices showing labeled axons in M2, and the track of a dye-coated linear array. Left: bright-field image. M2 is between the primary motor (M1) and anterior cingulate (AC) cortices. Right: epifluorescence image, showing labeled axons from RSC within M2, and the track of a dye-coated linear array (probe) that had been inserted in M2. (C) Depiction of experimental set-up showing aspects of the hardware control apparatus and wiring. An optical fiber (blue) was placed over, and a silicon probe was inserted into, each of the two cortical areas. The optical fibers were coupled to blue light-emitting diodes (LEDs). For clarity, only the fiber over the RSC is depicted here. See Methods for additional details. (D-G) Examples of RSC recordings during RSC photostimulation. (D) Raw (unfiltered) traces from the 32-channel linear array in the RSC, recorded during a single trial of RSC photostimulation (10 ms pulse, 100% intensity). The stimulus is indicated by the bar above, and by the blue box. The interior line with in the box indicates the 3-ms post-stimulus time point, which was the maximal width of the responses that were blanked to eliminate a stimulus artifact. The region demarcated by the black box is shown in the inset at the bottom. (E) Same, but after high-pass filtering. (F) Traces from a single channel, recorded on multiple stimulus presentations. Photostimulation reliably generated post-stimulus activity. (G) Top: Raster plot of detected events for a single trial (traces shown in E). Middle: Histogram showing events detected across all trials for each channel. Bottom: Overall histogram, calculated by summing across all channels. (H-K) Same as (D-G), for the recordings made simultaneously from the linear array inserted in M2. (L) Histograms for the RSC recordings, for 25 combinations of stimulus durations (1, 5, 10, 20, and 50 ms) and intensities (20, 40, 60, 80, and 100% of maximum). (M) Same, for the M2 recordings.

