Figure 2.

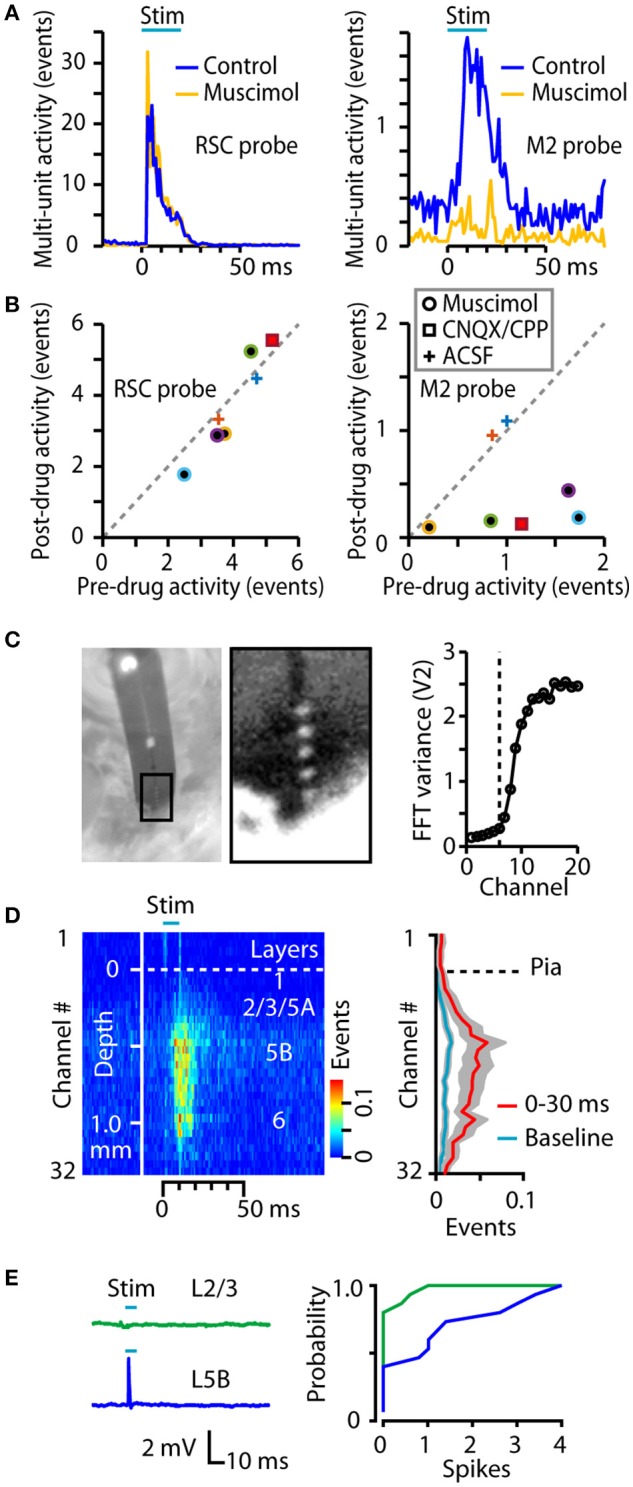
Additional characterizations of the technique. (A) Example histograms for responses to RSC stimulation, recorded before and after injection into M2 of muscimol. Muscimol, which suppresses synaptically driven activity, greatly reduced downstream activity in M2 (right) but not in RSC (left). (B) Responses recorded before and after injection into M2 of muscimol, CNQX/CPP, or ACSF (see legend for symbols). Drug injection did not affect activity in RSC (left) but significantly reduced responses in M2 (right; p = 0.013, t-test, n = 5). Colors indicate different experiments (animals). (C) Left: Image of 32-channel silicon probe, taken through the ocular of a stereoscope, showing 5 visible contacts above the penetration site into the cortex. Distance between contacts is 50 μm. Right: Plot of the variance in the FFT of the traces collected on the first 20 channels of the probe, showing an abrupt increase for channels deeper than the 6th contact (dashed line). (D) Left: Average peristimulus-time histogram across all channels in a 32-channel array in M2 during RSC photostimulation, plotted on a color scale (mean ± s.e.m., for n = 9 mice injected with AAV1-CAG-ChR2-Venus). Right: Average laminar profile, plotted as the average event rate per channel during the response interval (red) and baseline (blue). (E) In ex vivo brain slice experiments, cell-attached recordings were made from layer 2/3 and layer 5B neurons while photostimulating RSC axons. Left: Example traces showing spiking response in the layer 5B neuron. Right: The mean number of evoked spikes was calculated for each neuron, and plotted as a cumulative histogram of spike probability. Layer 5B neurons spiked significantly more than layer 2/3 neurons (p = 0.009, rank-sum test; median spikes were 0 vs. 1 for layer 2/3 vs. 5B, respectively; n = 15 layer 2/3 and 15 layer 5B neurons, recorded from 6 slices obtained from 3 animals).
