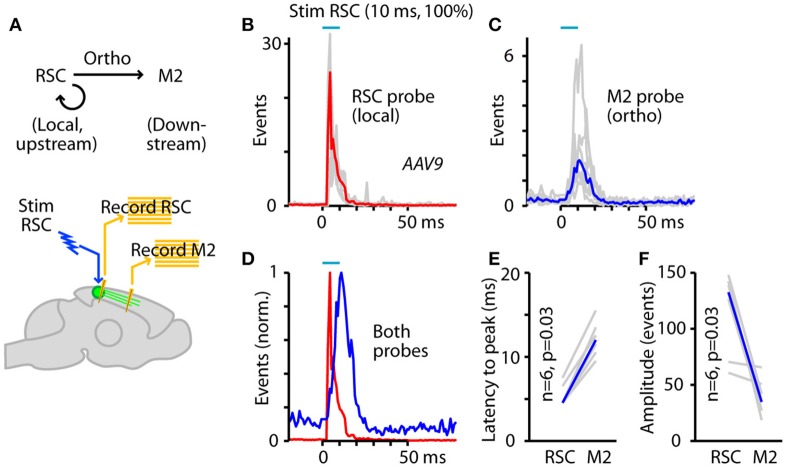
Figure 3.
Comparison of local RSC and downstream M2 activity evoked by RSC photostimulation. (A) Experimental paradigm: RSC neurons were infected with AAV to express ChR2, and photostimuli were applied to RSC while recording multi-unit activity in both M2 (orthodromically driven) and RSC (locally driven). (B) Activity recorded on the RSC probe during RSC stimulation in animals injected with AAV9-CaMKII-hChR2-eYFP. Red trace is the median response across 6 animals (traces for each animal shown in gray). (C) Activity recorded on the M2 probe during the same experiment. Blue trace is the median response across animals. (D) Overall activity on the RSC and M2 probes plotted together (peak-normalized). (E) Latencies (to peak) for responses recorded on the RSC and M2 probes. P-value calculated by 2-sided, paired sign test. (F) Amplitudes of responses (summed events) recorded on the RSC and M2 probes, plotted for each experiment (gray) and as the median across animals (blue). P-value calculated by 2-sided, paired sign test.

