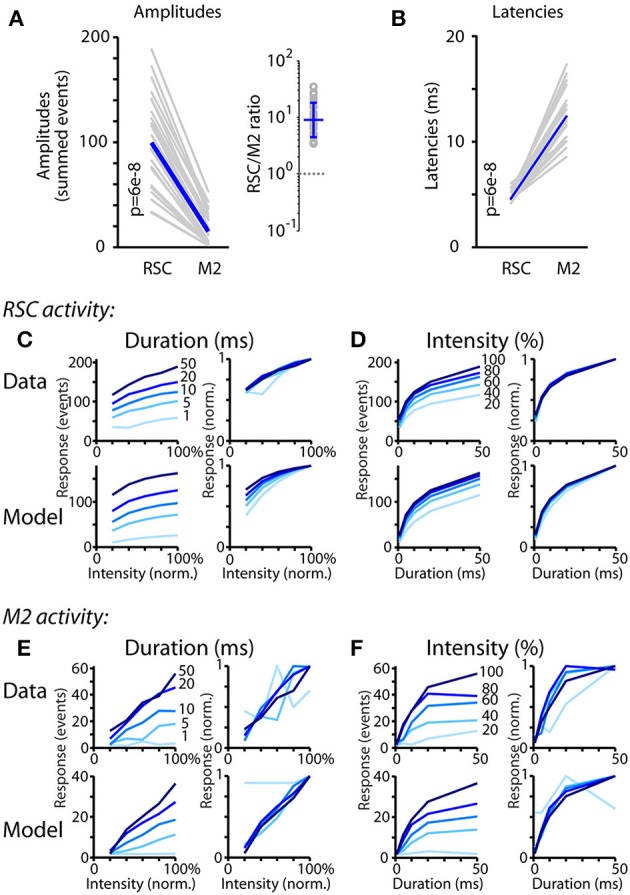
Figure 6.

Analysis of orthodromically driven response amplitudes and latencies. (A) Amplitudes (calculated as the summed events) of the responses recorded on the RSC and M2 probes during RSC photostimulation, for each of the 25 combinations of stimulus intensity and duration (gray) along with the median values (blue), plotted for AAV9-CaMKII-hChR2-eYFP experiments (see text for AAV1-CAG-ChR2-Venus results). P-values calculated by 2-sided, paired sign test. The RSC/M2 ratios for the 25 stimulus combinations are plotted on the right, with the geometric mean (error bars: geometric s.d.). (B) Same as (A), but for latencies. (C) Dependence of RSC responses on stimulus intensity and duration. Left, top: For the RSC recordings, response amplitudes are plotted as a function of stimulus intensity; each line is for data recorded at constant stimulus duration, as indicated. Left, bottom: Same analysis, for the modeled responses. Right plots: same curves but peak-normalized. Response amplitudes grew approximately linearly with stimulus intensity. (D) Same analyses as (D), but showing responses as a function of stimulus duration. Response amplitudes grew sub-linearly (approximately logarithmically) with stimulus duration. (E,F) Same as (D,E), but for M2 recordings.
