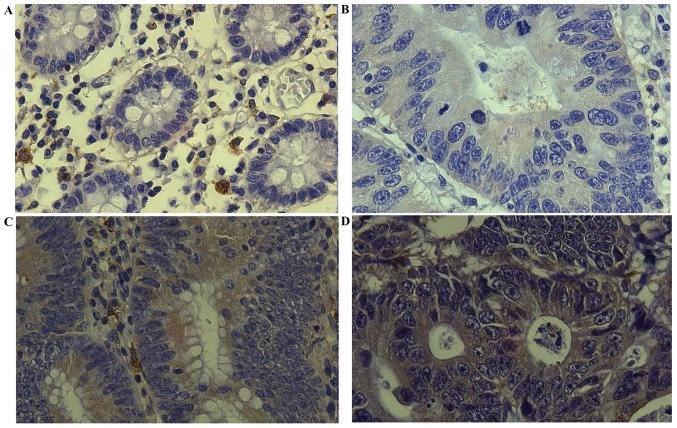
Figure 1.
Representative staining patterns. Staining intensity of NF-κB/p65 is shown. (A) Normal mucosa with negative staining (−). (B) Tumor tissue with intensity of 1 (+). (C) Tumor tissue with intensity of 2 (++). (D) Tumor tissue with intensity of 3 (+++) (Magnification, ×400). NF-κB, nuclear factor-κB.

