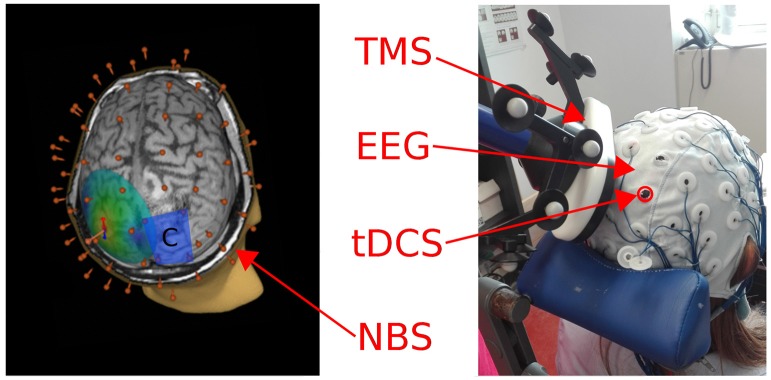
Figure 1.
Left: A 3D reconstruction of the individual MRI is depicted, showing the electrical field induced by TMS on the left parietal cortex. The blue rectangle represents the cathode patch position over the right parietal cortex, the 60 red points correspond to the position of the EEG cap electrodes. Right: A picture of the experimental setting used to deliver tDCS and TMS concurrently while recording EEG (during-tDCS condition).

