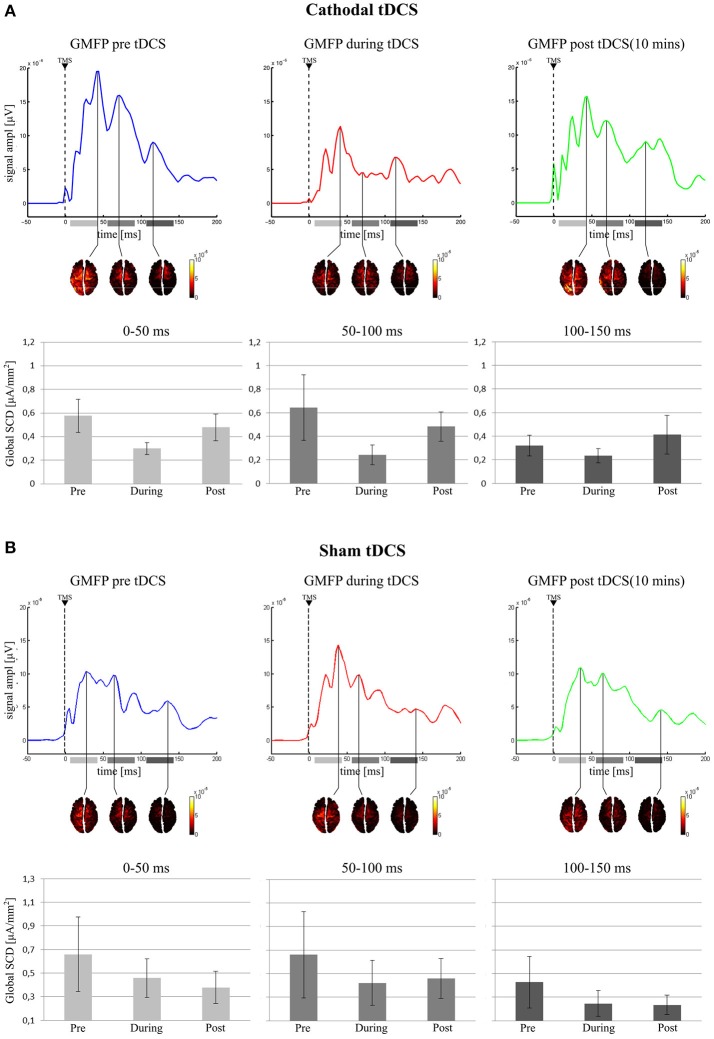
Figure 4.
Active vertexes and current spread at the local maxima in the GMFP for the three time-windows. In the (A) (Cathodal tDCS), for each recording session, the GMFP is shown on first top row, with the area beneath the curve divided in the three tested time windows (0–50 ms: light gray; 50–100 ms: gray; 100–150 ms: dark gray). The second row shows the estimated cortical sources in time coincidence with the maximum GMFP value, for each time window. In the last row are reported the mean values of the Global SCD for each condition and in each time window. (B) (Sham tDCS) shows the same results but for the sham group.

