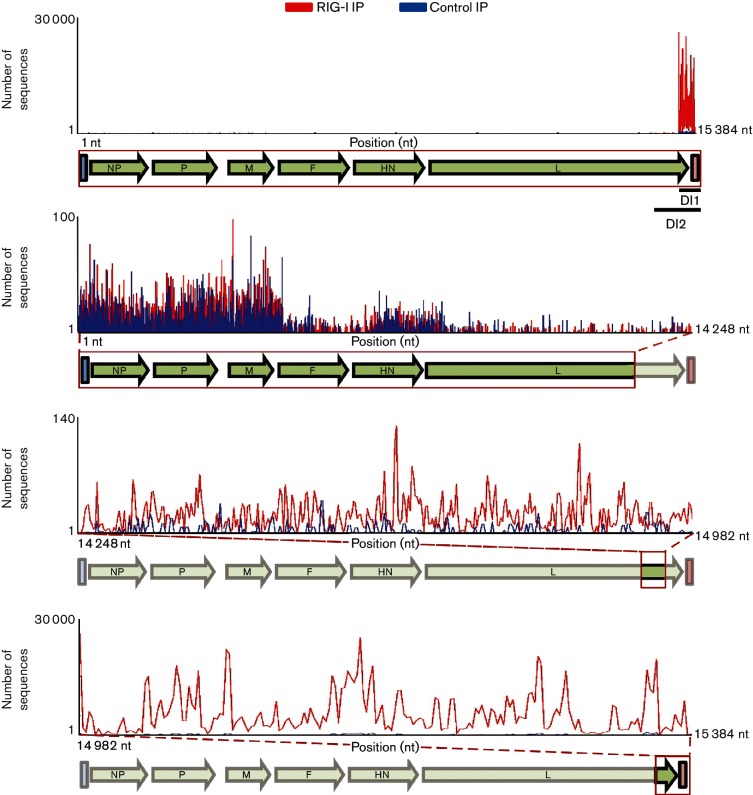
Fig. 2.
SeVΔC RNAs enriched in RIG-I IPs. Total RNA isolated with RIG-I (red) or control (blue) IP was subjected to deep sequencing. RNA-Seq reads are mapped to their corresponding position within the SeV genome. The top panel illustrates the entire SeV genome. The bottom three panels zoom in on highlighted regions of the SeV genome. The number of RNA-Seq reads is given on the Y-axis. RIG-I-specific enrichment, corresponding to DI RNAs, can be seen in the bottom two panels. The bottom panel encompasses reads mapping to both DI1 and DI2. The second from the bottom panel corresponds to reads mapping to DI2.

