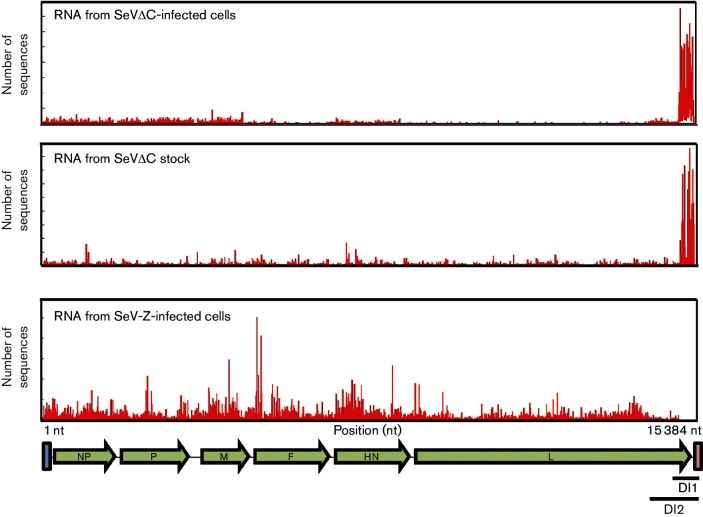
Fig. 3.
RNA-Seq profiles of SeVΔC-infected cells and virus stock. Reads from RNA-Seq were mapped to the SeV genome. DI RNA can be visualized as a strong peak on the 5′ end of the genome in both RNA from SeVC-infected cells and RNA from purified virus stock (top two panels). No DI RNA is apparent in SeV-Z-infected cells (bottom panel).

