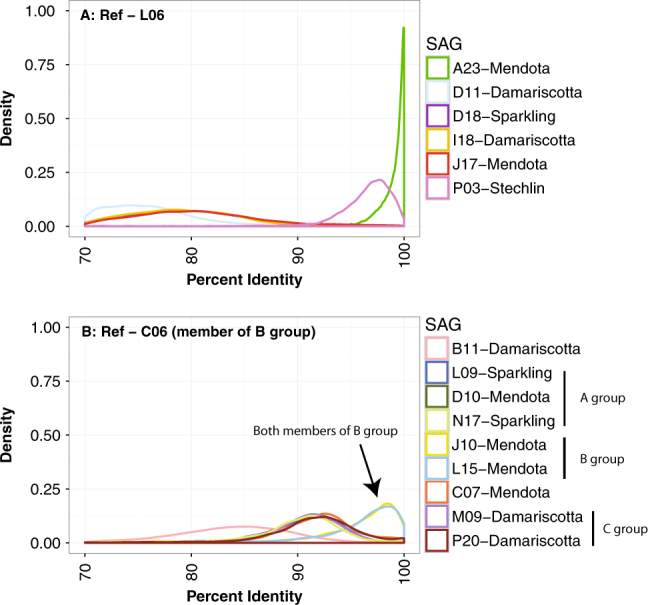
Fig. 2. Nucleotide identity density plots for SAG vs. SAG genome-wide comparison using a sliding window.

Results are shown for two reference SAGs representing the most complete genomes from the most thoroughly sampled tribes. All SAG pairs were from the same tribe. Nucleotide identity was calculated with blastn using 301 bp fragments that overlapped by 150 bp. a acI-B1 SAGs and other selected acI SAGs vs. L06. Note that the purple line (D18) is hidden underneath the orange (I18) and red (J17) lines. b Selected LD12 SAGs vs. C06. Note the dark blue line (L09) is hidden under the light green (N17) line. Group designations match those shown in Fig. 1b, as proposed previously [31]. An expanded multi-panel version of the same data is shown in Fig. S1, for clarity
