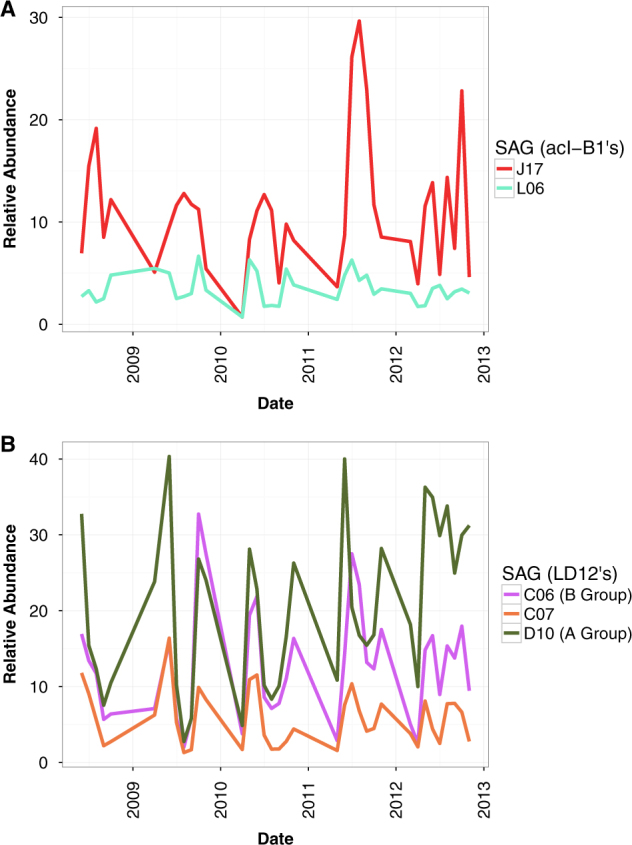
Fig. 4. Sequence-discrete population abundance in Lake Mendota over time, as measured by the relative number of reads recruited to each SAG using blastn.

All SAGs and samples are from Lake Mendota. Timepoints are pooled by month. Filtering criteria: ≥97.5% ANI and ≥200 bp alignment length. Recruitment was done using the most strict definition of competitive described in the methods, meaning any read that matched equally well to more than one SAG was not counted at all. Colors for each SAG are the same as in Figs. 2 and 3. Relative abundance was calculated by normalizing the number of basepairs that recruited to each SAG by dividing by the genome size and the pooled metagenome size. The normalized number was then multiplied by the average pooled metagenome size. a Relative abundance for each acI-B1 SAG. b Relative abundance for each LD12 SAG. Membership in the groups defined in Fig. 1b and by ref. [31] are denoted in the legend
