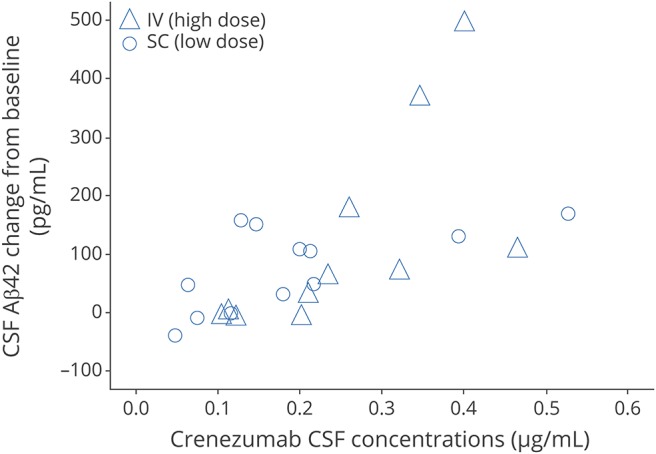
Figure 2. CSF Aβ1-42 and crenezumab correlation analysis.

Correlation analysis of change in CSF Aβ1-42 from baseline and crenezumab concentrations in patients receiving low-dose 300 mg SC (circles) and those receiving high-dose 15 mg/kg IV (triangles). Aβ = β-amyloid.
