
Figure 6.
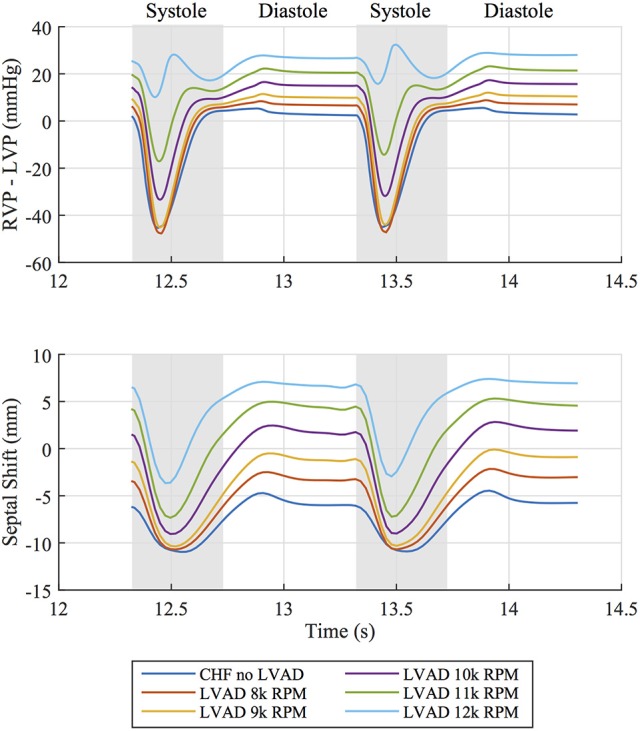
(Top) Pressure difference between right ventricular pressure (RVP) and left ventricular pressure (LVP) over two cardiac cycles for all simulated cases. (Bottom) Corresponding leftward septal shift over the same time period. Diastolic and systolic portions of the cardiac cycle are labeled.