Figure 8.
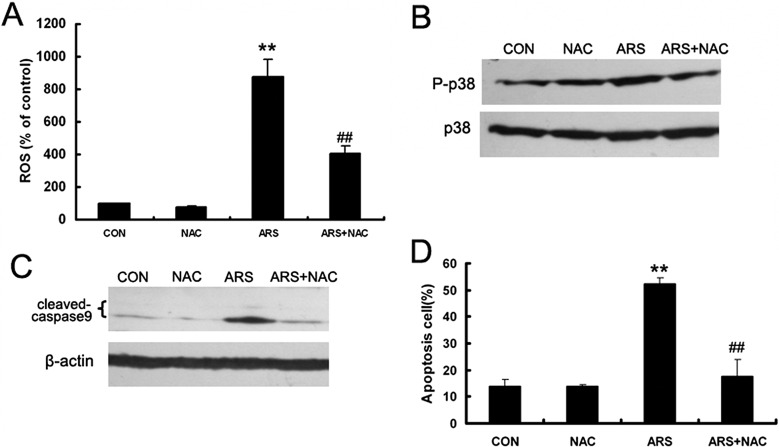
ARS induced formation of ROS in HUVECs. (A) HUVECs were pretreated with NAC for 3 hours and co-incubated with ARS for additional 4 hours. ROS formation was measured by flow cytometry. (B) After cotreated with ARS and NAC for 8 hours, phosphorylation of p38MAPK was detected by Western blot analysis and the bands were semiquantified with densitometry in HUVECs. (C) HUVECs were co-incubated with ARS for 24 hours. Cleavage level of caspase 9 was determined by Western blot analysis. (D) Apoptotic HUVECs were quantified by flow cytometry. n = 3. ** and ## denote P < 0.01, respectively. *: versus control group, #: versus ARS group.

