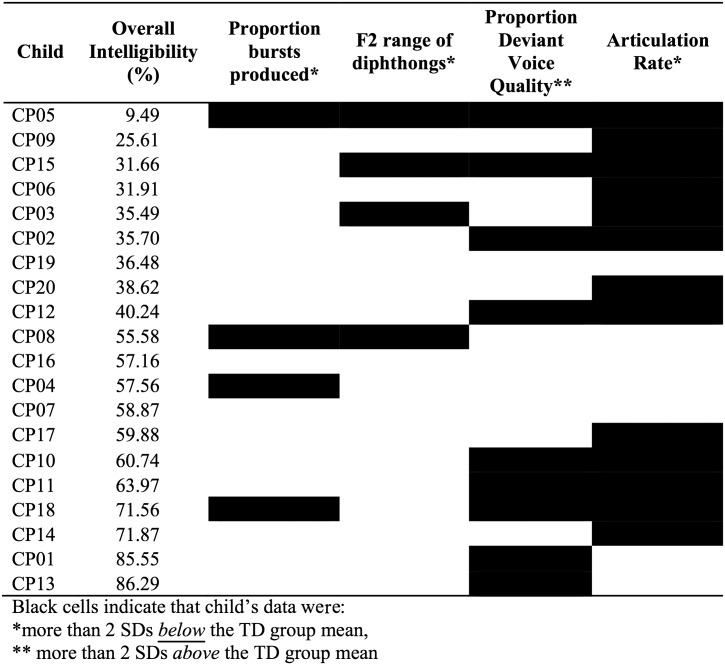
Figure 7.
Individual profiles of children in the speech motor impaired (SMI) group compared to mean and standard deviation of the typically developing (TD) group. Children are listed in order of increasing intelligibility. Black cells indicate that the child's data were more than 2 SDs away from the mean of the TD group. (Proportion of closure interval voicing is not included, as measurements from all children in the SMI group were within 2 SDs of the TD group mean.)

