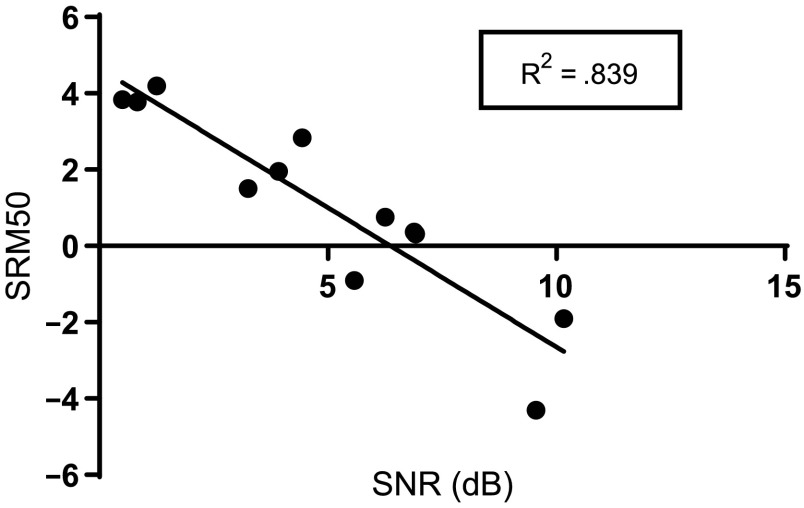
Figure 5.
Scatter plot of SRM values (in dB) with 50° of spatial separation and the distracter positioned near each participant's “poorer” ear as a function of the SNR needed to obtain 50% correct speech understanding. Solid line is a linear regression. SRM = spatial release from masking; SNR = signal-to-noise ratio.

