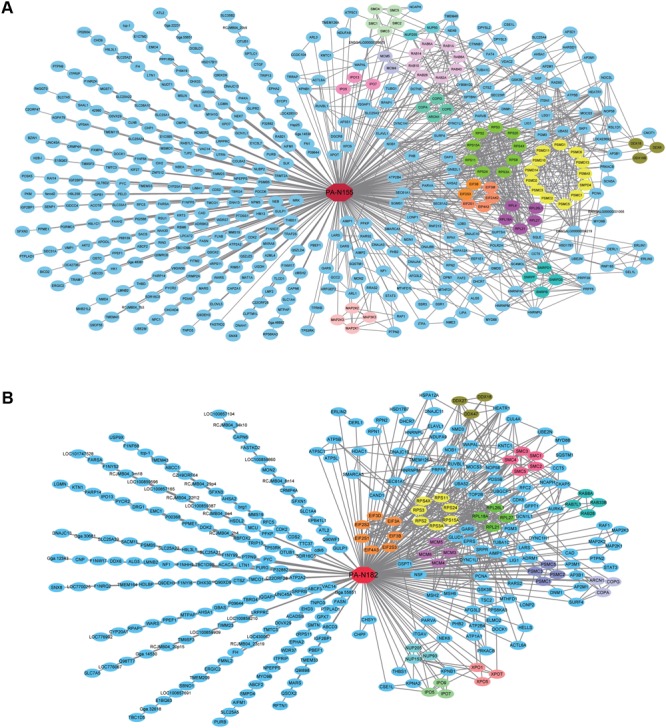
FIGURE 2.

Virus–host predicted interaction network of PA-N155 and PA-N182 in chicken cells. (A) PA-N155 host interaction and interactions between PA-N155-associated host proteins are shown. (B) PA-N182 host interaction and interactions between PA-N182-associated host proteins are shown. Red nodes in the center of the network represent PA-N155 and PA-N182, and the other nodes represent chicken proteins. Proteins in the same family are often involved in the interactions in the form of complexes, and we expressed them in the same color. Interactions between host factors were incorporated using interaction data from STRING.
