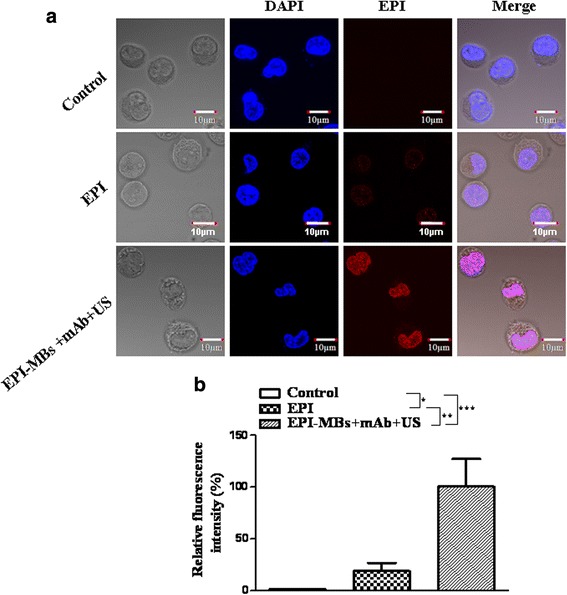
Fig. 1.

Analysis of epirubicin (EPI) entering MM CSCs. The images acquired from the confocal fluorescence microscopy were analyzed with Image J software, and the fluorescence intensity of cells in EPI-MBs + mAb + US was set to 100 to provide a basis for comparison. The relative fluorescence intensity of various groups was calculated. a Representative images show EPI entering MM CD138−CD34− CSCs (red) 30 min after cells were respectively incubated with PBS (control), EPI (10 μg/mL), and EPI-MBs + mAb + US (0.5 W/cm2) and then stained with 4’,6-diamidino-2-phenylindole (DAPI) for 10 min as described in the Methods. Blue, red, and pink fluorescence intensity represents the DAPI (cellular nucleus), EPI (entering MM CSCs), and these merged, respectively. b Quantification of red fluorescence intensity in the different treated cells. *P < 0.05, ** P < 0.01, *** P < 0.005. EPI, epirubicin; mAb, monoclonal antibody; MB, microbubble; US, ultrasound
