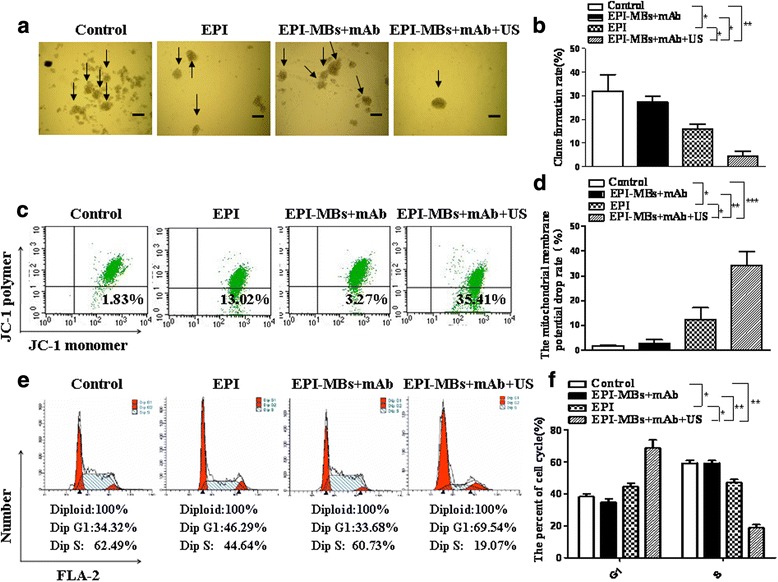
Fig. 2.

Analysis of clone formation, membrane potential, and cell cycle of MM CSCs. As described in the Methods, 1 × 10⁶ MM CSCs treated with various agents for 30 min were used for assay clone formation, membrane potential, and cell cycle analysis. a Images showing clone formation rate. c,e Changes in mitochondrial membrane potential and cell cycle were analyzed by FCM. b,d,f Statistical analysis of the clone formation rate and changes in mitochondrial membrane potential and cell cycle. *P < 0.05, **P < 0.01, ***P < 0.005. EPI, epirubicin; mAb, monoclonal antibody; MB, microbubble; US, ultrasound
