Fig. 3.

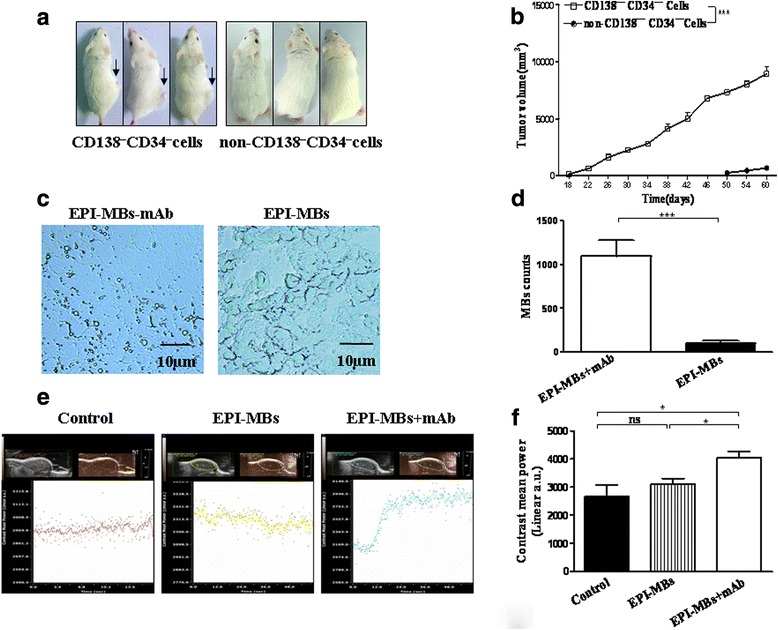
Detection of EPI-loaded MBs in MM tissues. a Images of tumor-bearing mice on day 34 after 1 × 10⁶ MM CD138−CD34− cells or non-MM CD138−CD34− cells were injected s.c. into NOD/SCID mice. b Dynamic tumor growth curve. c MBs were located in the MM tissues of mice injected with EPI-MBs + mAb (left) or EPI-MBs (right) 30 min after injection. d Quantification analysis was performed on tumor sections observed under light microscopy according to MB counts in EPI-MBs + mAb and EPI-MBs groups. e Ultraphonic echo intensity was analyzed as described in the Methods. f Ultraphonic echo intensity of statistical comparisons referring to G1 or S. *P < 0.05, *** P < 0.005. EPI, epirubicin; mAb, monoclonal antibody; MB, microbubble; ns, not significant
