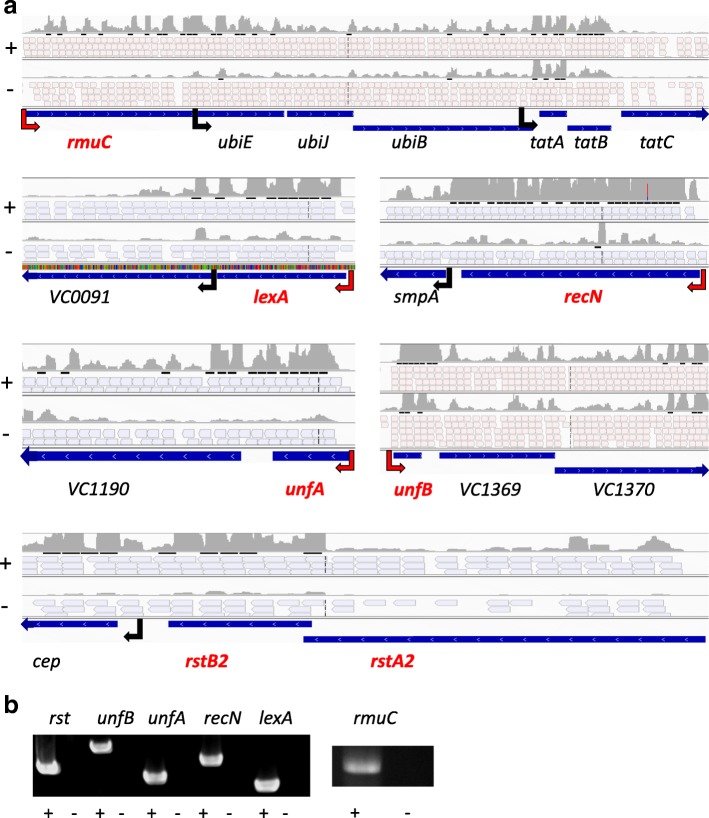
Fig. 2.
SOS regulon operons. a. RNA-seq data in marine medium in presence (+) or absence of mitomycin C (−). For each operon, the top track corresponds to the piling up signal of all reads. The middle tracks correspond to individual reads; for pink reads: the sense of transcription is leading strand; in blue: the sense of transcription is the lagging strand. The bottom track shows gene annotation in the Vibrio cholerae genome. Genes known to belong to the SOS regulon are shown in red. Black arrows correspond to the intermediary transcriptional starts, red to the gene’s first TSS. b. RT-PCR for entire operons in presence (+) and absence (−) of superscript III reverse transcriptase

