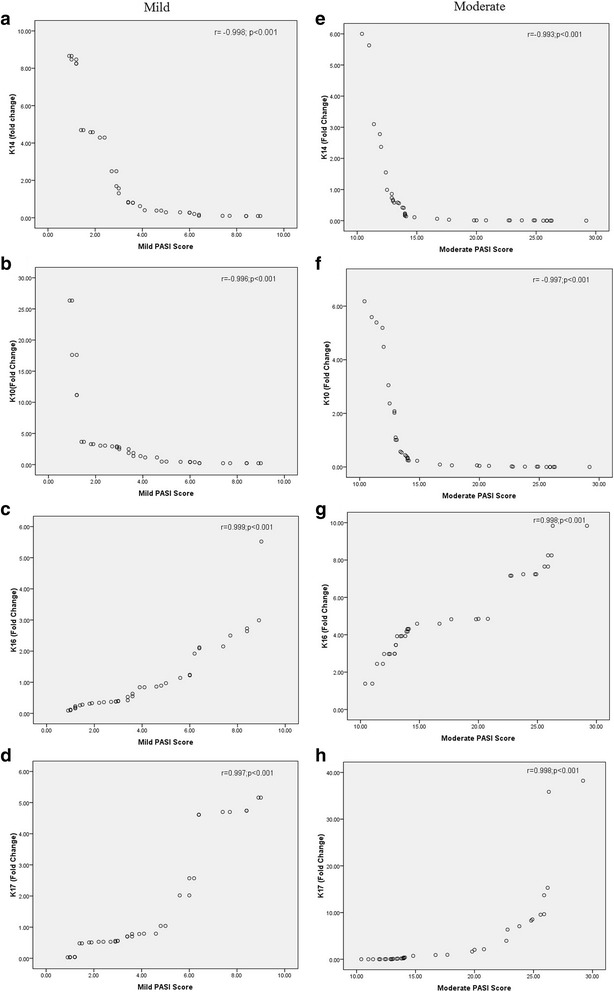
Fig. 8.

Correlation between keratins with PASI score. a Keratin 14 vs. mild PASI score. b Keratin 10 vs. mild PASI score. c Keratin 16 vs. mild PASI score. d Keratin 17 vs. mild PASI score. e Keratin 14 vs. moderate PASI score. f Keratin 10 vs. moderate PASI score. g Keratin 16 vs. moderate PASI score. h Keratin 17 vs. moderate PASI score. The correlation coefficient (r) and significant value (P) are given in this figure
