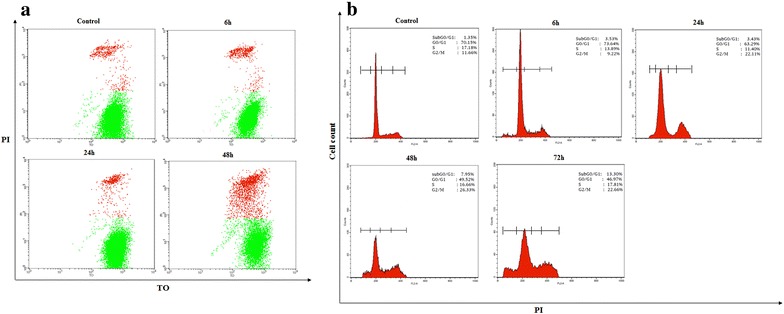
Fig. 2.

a Effect of irradiation with a 10 Gy dose on the viability of T98G cell line. Flow cytometry histogram showing the changes in percentage of dead (colored by PI, in red) and live cells (colored by TO and PI, in green), with elapsed time after irradiation indicated. b Effect of irradiation with a 10 Gy dose on T98G cell cycle distribution. Flow cytometry histogram showing the cell distribution according to DNA content
