
Fig. 2.
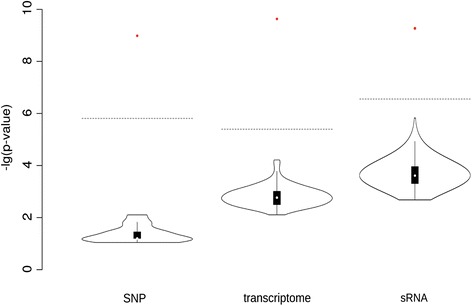
Permutation analysis with shuffled hybrid trait values with SNP, transcriptome (mRNA), or sRNA data. The lowest p-values of each permutation run (black violin plot) and of the actual genotype-trait allocation (red dot) are represented. The dotted line indicates the threshold to reach significance at 5% FDR