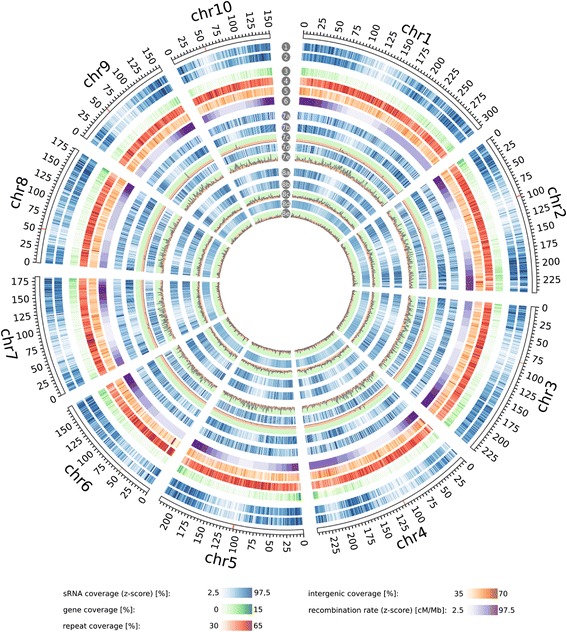
Fig. 6.

Genome-wide distribution and enrichment of sRNAs. Genomic coverage of hpa-sRNAs (1), all sRNAs (2), genes (3), repeats (4), intergenic regions (5) and recombination rates (6) throughout the B73 reference genome. Distribution of 22-nt sRNAs (7a), positively 22-nt hpa-sRNAs (7b), negatively 22-nt hpa-sRNAs (7d), 24-nt sRNAs (8a), positively 24-nt hpa-sRNAs (8b), negatively 24-nt hpa-sRNAs (8d) on the B73 reference genome. -log10 plot of enrichment probabilities of positively 22-nt hpa-sRNAs (7c), negatively 22-nt hpa-sRNAs (7e), positively 24-nt hpa-sRNAs (8c) and negatively 24-nt hpa-sRNAs (8e). Peaks in green background zone show significant enrichment (p < 0.05). All distributions are shown in 1 Mb resolution. Centromeres according to Jiao et al. [31] are indicated red in the rulers. Whole-genome visualization was created with Circos [43]. Annotations in (2) to (4) are according to genome assembly AGPv4.36
