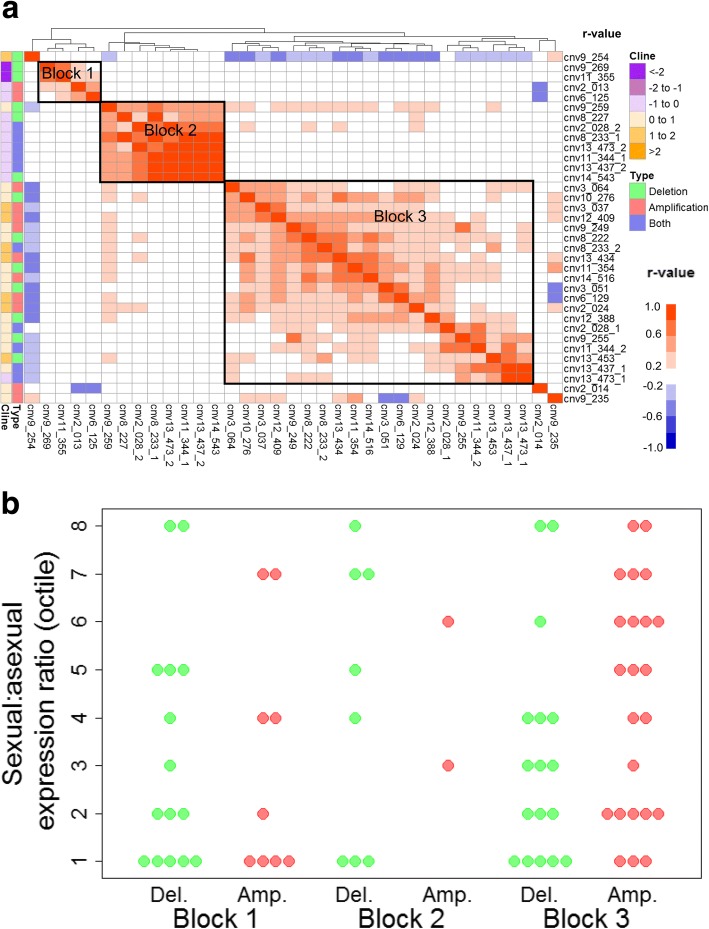
Fig. 4.
Associations between CNVs and sexual stage function. a pairwise linkage disequilibrium between CNV alleles. Heatmap colours indicate the strength and direction of the correlation between isolates across populations (r-value, white indicates the same CNV). Colour bars on left indicate the type of CNV and the strength and direction of its transmission intensity related frequency clines. CNVs were clustered (top dendrogram) by similarity in correlation profiles. CNVs with low linkage disequilibria are excluded. b Ratio of sexual to asexual stage expression (y-axis) for individual inside the genes in (a) grouped by linkage disequilibrium block and CNV type (Amp., amplification; Del., deletion)

