
Fig. 5.
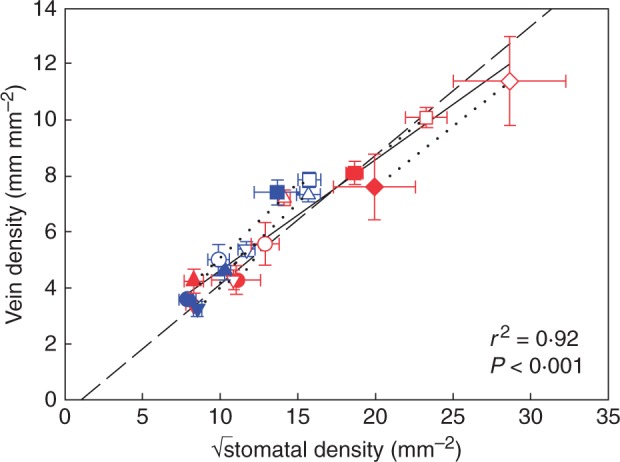
Observed relationship between vein density and stomatal density (black solid line) compared with the modelled relationship (black dashed line, see the Materials and Methods for details). Symbols show the mean observed values ± s.d. of the five woody species (including Toona ciliata) and the four herbaceous species grown in sun and shade (symbols as in Fig. 1) (sun and shade species pairs joined by a black dotted line). A single regression through the pooled data is shown as a black solid line; DV = 0·395 × √DS + 0·683 (r2 = 0·92, F1,16 = 186·3, P < 0·001). This linear regression is not significantly different from the modelled relationship.