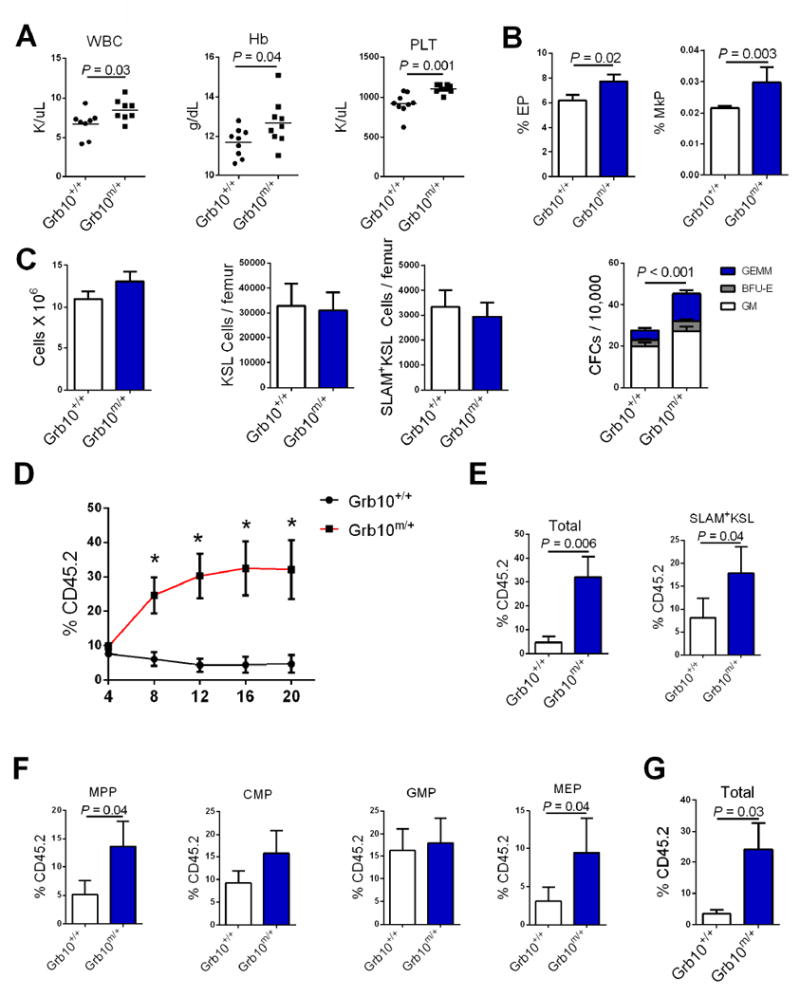
Figure 2. Maternal deletion of Grb10 increases HSC repopulating capacity.

(A) Scatter plots of PB white blood counts (WBC), hemoglobin (Hb) and platelet counts (PLT) in 8 week old Grb10 m/+ mice and Grb10 +/+ mice (n=8–10 mice/group). (B) Mean percentages of erythroid progenitors (EPs) and megakaryocyte progenitors (MkPs) in Grb10 m/+ mice and Grb10 +/+ mice (n=8/group). (C) Mean BM cell counts, KSL cells, SLAM+KSL cells and CFCs in Grb10 m/+ mice and Grb10 +/+ mice (n=6-12/group; GEMM=colony forming unit-granulocyte erythroid monocyte megakaryocyte; BFU-E=burst forming unit-erythroid; GM=colony forming unit-granulocyte macrophage. (D) Donor (CD45.2+) cell engraftment over time in recipient CD45.1+ mice transplanted with 5 × 10⁴ BM cells from Grb10 m/+ mice or Grb10 +/+ mice, together with 2 × 10⁵ CD45.1+ competitor BM cells (n=8/ group. P=0.007, P=0.001, P=0.003, P=0.006 for 8, 12, 16, and 20 weeks, respectively, Mann-Whitney test). (E) Left, mean total donor CD45.2+ cells in the PB of recipient CD45.1+ mice at 20 weeks following competitive transplantation in each group; at right, mean donor-derived HSCs (SLAM+KSL cells) in the BM of recipient mice following competitive transplantation (n=8/group, Mann-Whitney test). (F) Mean donor-derived MPPs, CMPs, GMPs and MEPs in the BM of recipient mice following competitive transplantation (n=8/group, Mann-Whitney test). (G) Mean total donor CD45.2+ cells in secondary recipient mice at 12 weeks following competitive transplantation (3 × 10⁶ donor BM cells, 2 × 10⁵ competitor cells, n = 10-12/group; Mann-Whitney test)(all panels, means ± SEM). See also Figure S1.
