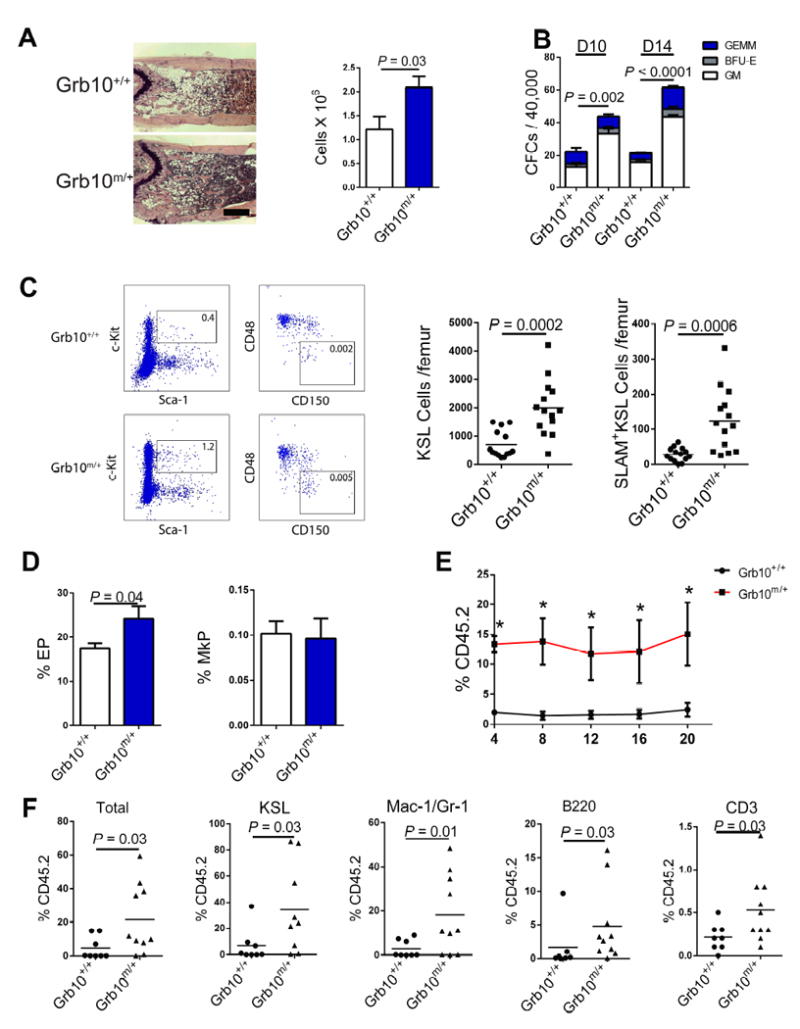
Figure 3. Maternal deletion of Grb10 promotes HSC regeneration following irradiation.

(A) Representative H & E stained femurs from Grb10 m/+ mice and Grb10 +/+ mice at day +10 following 550 cGy TBI and mean BM cell counts in each group (n=8 mice/group; 5x magnification, scale bar=500 μm). (B) Mean BM CFCs in Grb10 m/+ mice and Grb10 +/+ mice at day +10 and day +14 following 550 cGy TBI (n=6/group). (C) A representative flow cytometric plot of BM KSL cells and SLAM+KSL cells and numbers of BM KSL cells and SLAM+KSL cells are shown in Grb10 +/+ mice and Grb10 m/+ mice at day +10 following 550 cGy TBI (n=12 – 14 mice/group; percentages of KSL and SLAM+KSL cells are shown in the gates. Mean values represented by horizontal lines). (D) Mean percentages of erythroid progenitors (EPs) and megakaryocyte progenitors (MkPs) in Grb10 m/+ mice and Grb10 +/+ mice at day +10 following 550 cGy TBI (n=5/group). (E) Donor (CD45.2+) cell engraftment over time in the PB of recipient CD45.1+ mice transplanted with 5×10⁵ BM cells from Grb10 m/+ or Grb10 +/+ mice at day +10 following 550 cGy TBI, together with 1×10⁵ CD45.1+ competitor BM cells (n = 8 - 10/group, P=0.002, P=0.01, P=0.001, P=0.008, and P=0.03, for 4, 8, 12, 16 and 20 weeks, respectively; Mann-Whitney test). (F) Scatter plots show the percentage donor CD45.2+ cell, KSL cell, Mac-1/Gr-1+, B220+ and CD3+ engraftment in the BM at 20 weeks following competitive transplantation of irradiated donor BM cells from each group into recipient CD45.1+ mice (n = 8 - 10/group, Mann-Whitney test)(all panels, means ± SEM).
