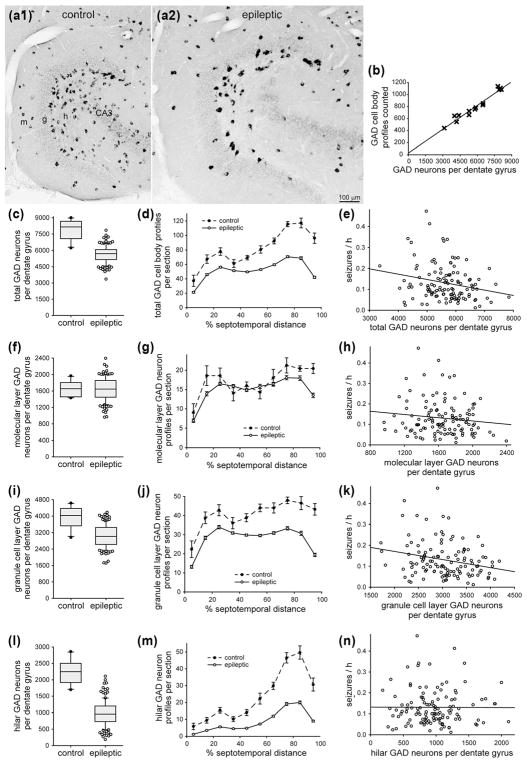
FIGURE 7.
Significant negative correlation between the number of GABAergic neurons in the dentate gyrus and seizure frequency in epileptic pilocarpine-treated mice. GAD in situ hybridization in sections of the dentate gyrus in a control (a1) and epileptic mouse (a2). The dentate gyrus is larger in the epileptic mouse. There are fewer GAD-positive neurons, but they are labeled more intensely in the epileptic mouse. Sections are 75% of the distance from the septal pole to the temporal pole of the hippocampus. g = granule cell layer; h = hilus; m = molecular layer. (b) High correlation between the number of hilar GAD-positive cell body profiles counted and the number of GAD-positive neurons per dentate gyrus estimated by the optical fractionator method in a subset of mice in this study (R = 0.977, p <0.001, ANOVA). (c) Fewer total GAD-positive neurons per dentate gyrus in epileptic mice (n = 122) compared to controls (n = 10, p <0.001, t test). (d) Septotemporal distribution of GAD-positive cell body profiles per section. Values represent mean ± SEM. (e) Significant negative correlation between the total number of GAD-positive neurons per dentate gyrus and seizure frequency (R = 0.199, p = 0.029, ANOVA). (f) No significant difference in the number of GAD-positive neurons in the molecular layer per dentate gyrus in epileptic mice compared to controls (p = 0.999, t test). (g) Septotemporal distribution of molecular layer GAD-positive cell body profiles per section. (h) No significant correlation between the total number of molecular layer GAD-positive neurons per dentate gyrus and seizure frequency (R = 0.129, p = 0.160, ANOVA). (i) Fewer GAD-positive neurons in the granule cell layer per dentate gyrus in epileptic mice compared to controls (p <0.001, t test). (j) Septotemporal distribution of granule cell layer GAD-positive cell body profiles per section. (k) Significant negative correlation between the number of granule cell layer GAD-positive neurons per dentate gyrus and seizure frequency (R = 0.229, p = 0.012, ANOVA). (l) Fewer GAD-positive neurons in the hilus per dentate gyrus in epileptic mice compared to controls (p <0.001, Mann–Whitney rank sum test). (m) Septotemporal distribution of hilar GAD-positive cell body profiles per section. (n) No significant correlation between the number of hilar GAD-positive neurons per dentate gyrus and seizure frequency (R = 0.001, p = 0.996, ANOVA)

