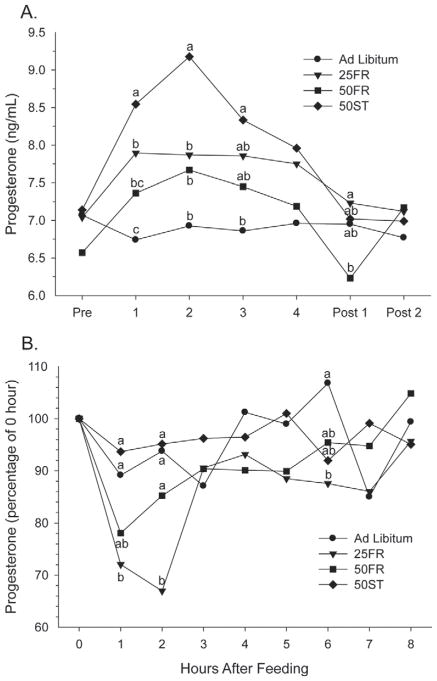
Figure 7.
Circulating progesterone concentrations (A) during the entire experimental period (ng/mL) and (B) during the intensive measurements calculated as a percentage of the 0 h sample in cows exposed to 1 of 4 treatments: ad libitum, 25% feed restriction (25FR), 50% feed restriction (50FR), and 50% of TMR replaced with wheat straw (50ST). a–cWithin day, means with different letters differ (P < 0.05).

