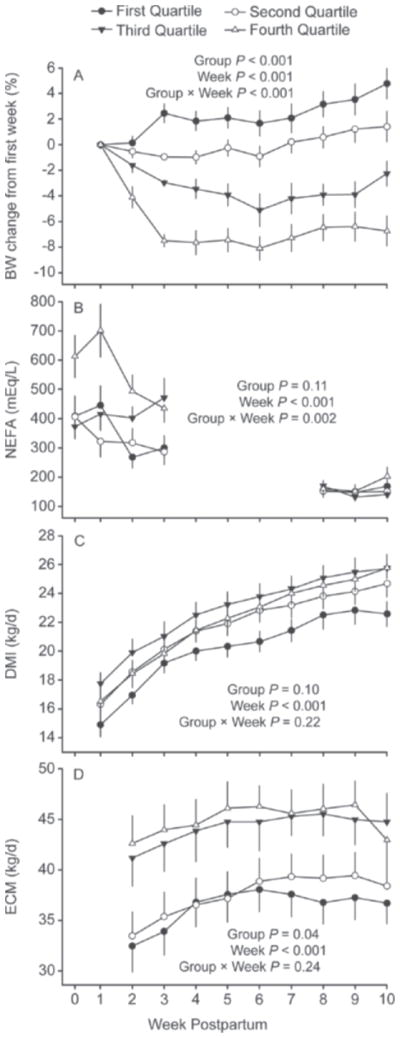
Figure 4.

Percentage BW change from first week postpartum (panel A), NEFA concentrations during the first 3 wk postpartum and during the synchronization period (panel B), DMI (panel C), and ECM yield (panel D). Cows were ranked according to percentage BW change from the first to third week postpartum and divided into quartiles. Values are means ± SEM.
