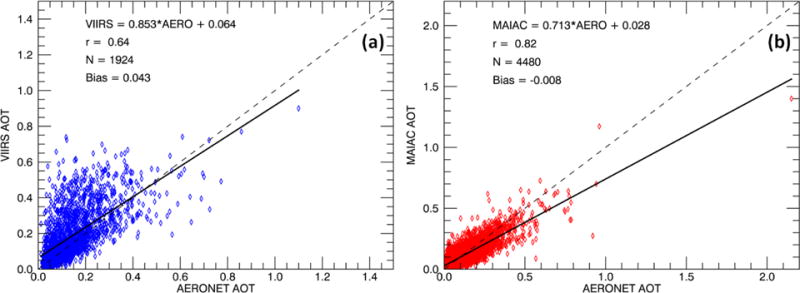
Figure 4.

Scatter plots showing the relationship between AERONET AOT and VIIRS (a) and MAIAC (b). The dashed line represents the 1:1 line where the two datasets would be in complete agreement, while the solid lines represent the linear regression model (chi-squared test) provided at the top of each figure. Relevant relational statistics for correlation, r; number of observation, N; and bias are also given.
