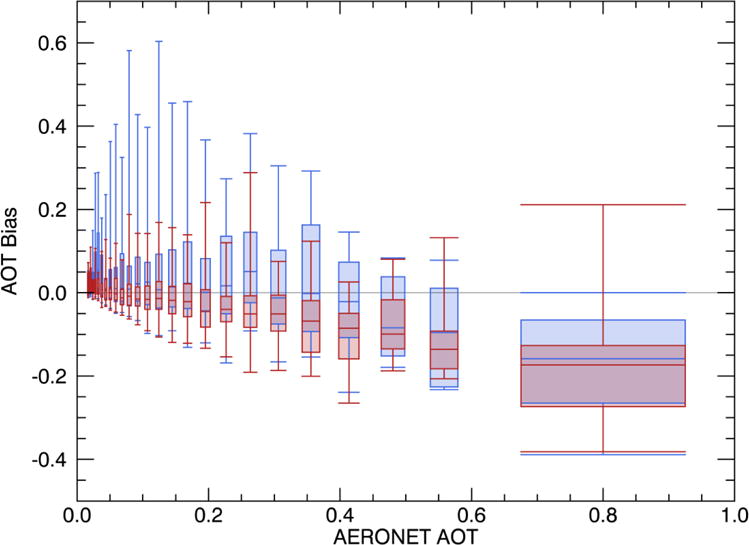
Figure 5.

Box and whisker plot showing the dependence of the VIIRS (blue) and MAIAC (red) bias on the AOT as measured by AERONET. Any missing data is due to the lack of matchups (< 5) in that AOT bin.

Box and whisker plot showing the dependence of the VIIRS (blue) and MAIAC (red) bias on the AOT as measured by AERONET. Any missing data is due to the lack of matchups (< 5) in that AOT bin.