
Figure 3.
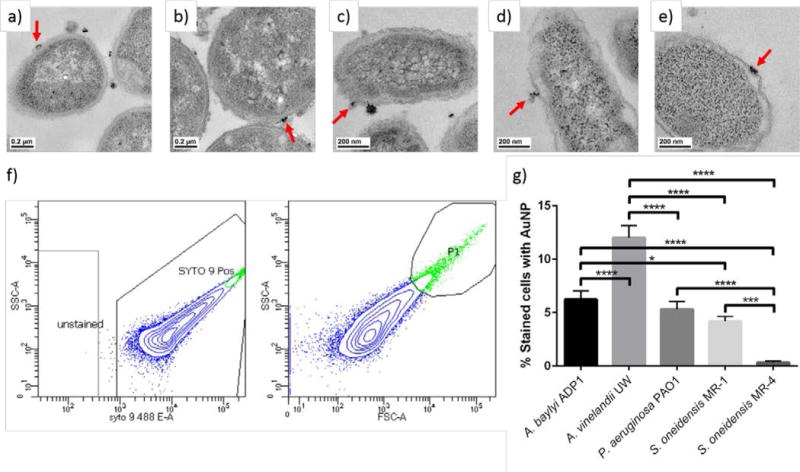
Transmission electron micrographs showing association of PAH AuNPs with a) A. baylyi ADP1, b) A. vinelandii UW, c) P. aeruginosa PAO1, d) S. oneidensis MR-1, and e) S. oneidensis MR-4. The red arrows show an example of PAH AuNP attachment to the bacterial cell wall. Representative flow cytometry data for f) A. baylyi exposed to 2.81 ppm PAH AuNPs. The left plot was used to identify cells based on the presence of SYTO9 stain, which is the boxed region of events labeled “SYTO 9 Pos”. The right plot contains only the cells present in the boxed region of the left plot, and the events with both high side scattering and forward scattering were the population of cells with bound AuNPs. This gate was drawn using the maximum scattering seen in cells that were not exposed to PAH AuNPs. The blue dots correspond to cells stained with SYTO9 and the green events are stained bacterial cells that are bound to AuNPs. From flow cytometry, the percentage of cells that were bound to AuNPs are shown for the bacterial species after exposure to g) 2.81 ppm PAH AuNPs. *p<0.05, ***p<0.001, and ****p<0.0001.